Demand to fall below levels seen during the 2008 financial crisis
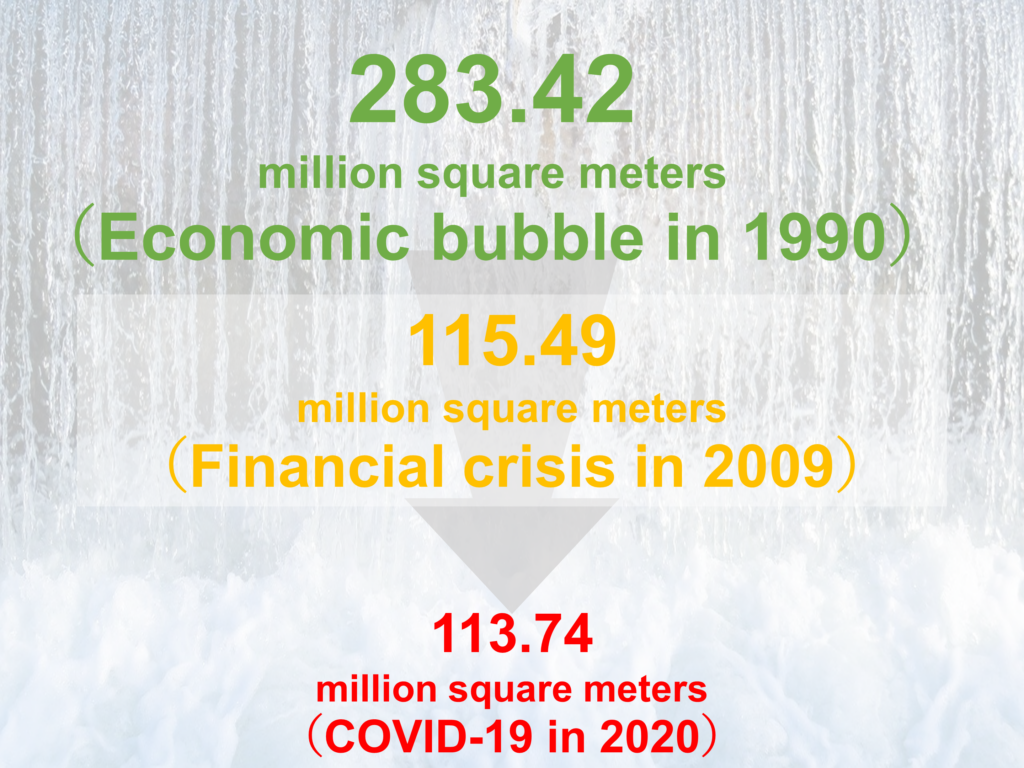
According to the “Survey of Building Starts” released by the Ministry of Land, Infrastructure, Transport and Tourism on January 29, 2021, nationwide demand for building starts in 2020 totaled 113.74 million square meters on a floor area basis, the lowest level in 54 years.
Given that building starts are generally categorized into residential and non-residential, this article will focus on floor area based on the following perspectives.
- Overall demand for building starts
- Demand for residential starts
- Demand for non-residential starts
- Summary
1. Overall demand for building starts
Nationwide, demand for building starts totaled 113.74 million square meters in terms of floor area. This level is lower than the 115.49 million square meters in 2009, during the financial crisis, and is the lowest level in 54 years, following the 109.74 million square meters recorded in 1966. (See figure below)
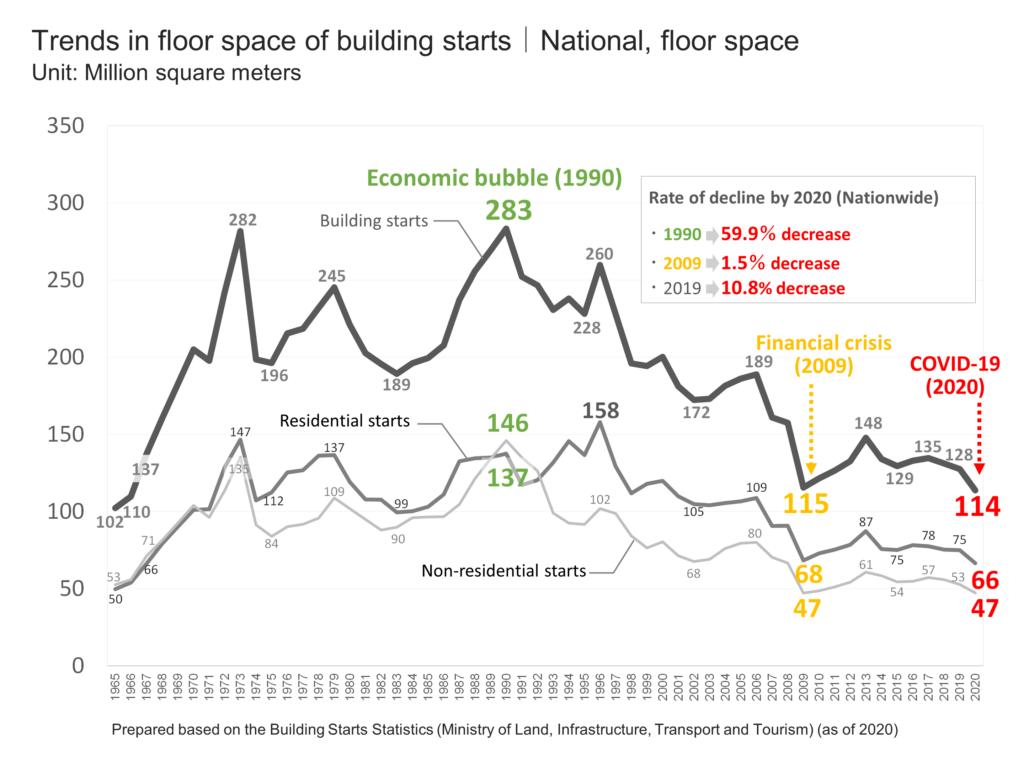
The historically low level of demand in 2020 can be largely attributed to two factors: a reactionary decline in demand following the rush to buy caused by the consumption tax hike in October 2019, and a drop in demand due to stagnant economic activity resulting from the outbreak of COVID-19 in early 2020.
The level of demand for construction starts in 2020 was 59.9%, 1.5%, and 10.8% lower than the levels recorded during the economic bubble (1990), the financial crisis (2009), and before the outbreak of COVID-19 (2019), respectively. (See figure above)
2. Demand for residential starts
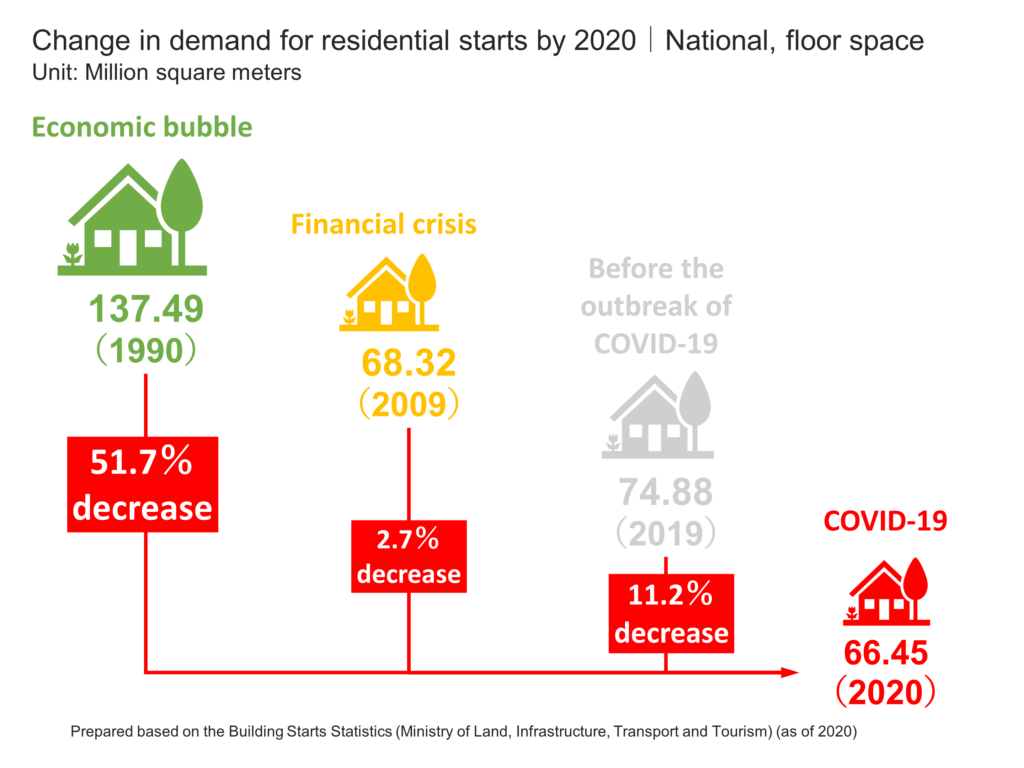
Next, nationwide demand for residential starts were 66.45 million square meters on a floor area basis. This level is lower than the 68.32 million square meters recorded in 2009 during the financial crisis, and is the lowest level in 53 years, following the 66.17 million square meters recorded in 1967.
It can also be said that the level of demand for residential starts in 2020 was 51.7%, 2.7%, and 11.2% lower than the levels recorded during the economic bubble, financial crisis, and prior to the outbreak of COVID-19 in 1990, 2009, and 2019, respectively. (See figure below)
Similarly, a look at changes in demand for residential starts by use by 2020 show that owner-occupied residential starts have declined by 54%, 15%, and 10%, and rental residential starts have declined by 61%, 8%, and 13%, since the economic bubble (1990), financial crisis (2009), and prior to the outbreak of COVID-19, respectively. (See chart below)
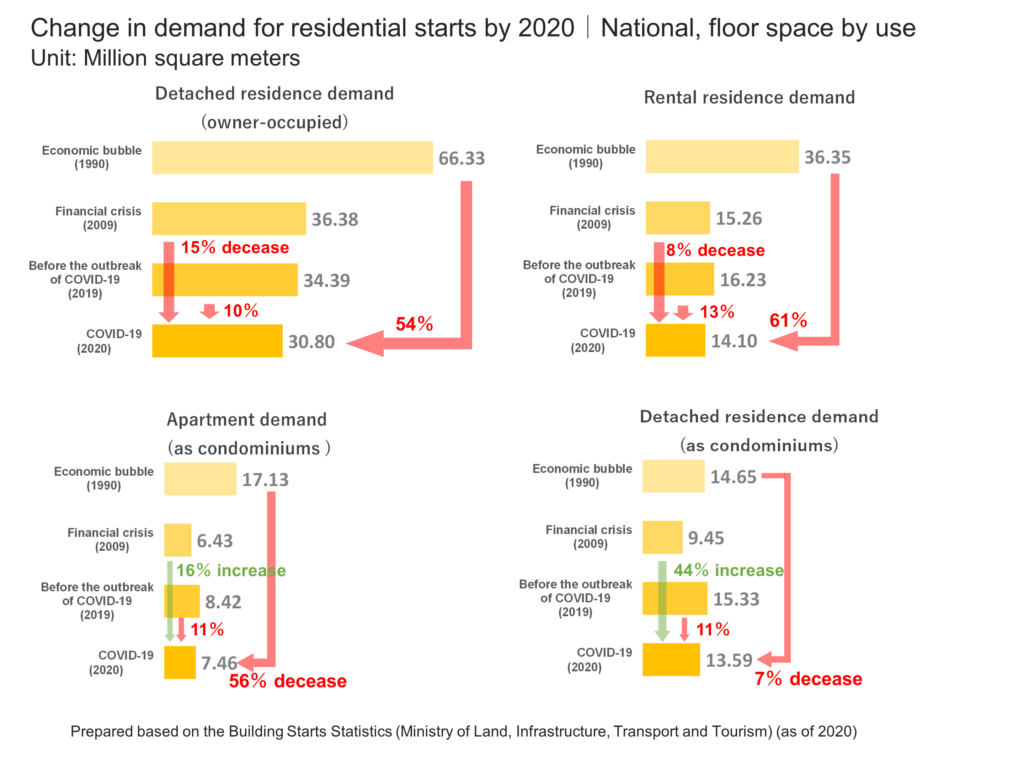
In the case of condominiums, demand for apartment-type condominiums have decreased by 56%, increased by 16%, and decreased by 11%, while demand for detached condominiums have decreased by 7%, increased by 16%, and decreased by 11%, respectively, since the economic bubble, financial crisis and before the outbreak of COVID-19. (See figure above)
From this, we can see that the demand for residential starts in 2020 by type of use is declining for all from the levels recorded during the economic bubble (1990) and before the outbreak of COVID-19 (2019). On the other hand, demand for condominiums and detached condominiums have increased from levels seen during the financial crisis (2009), indicating that the trend is different from that of owner-occupied houses and rental houses.
3. Demand for non-residential starts
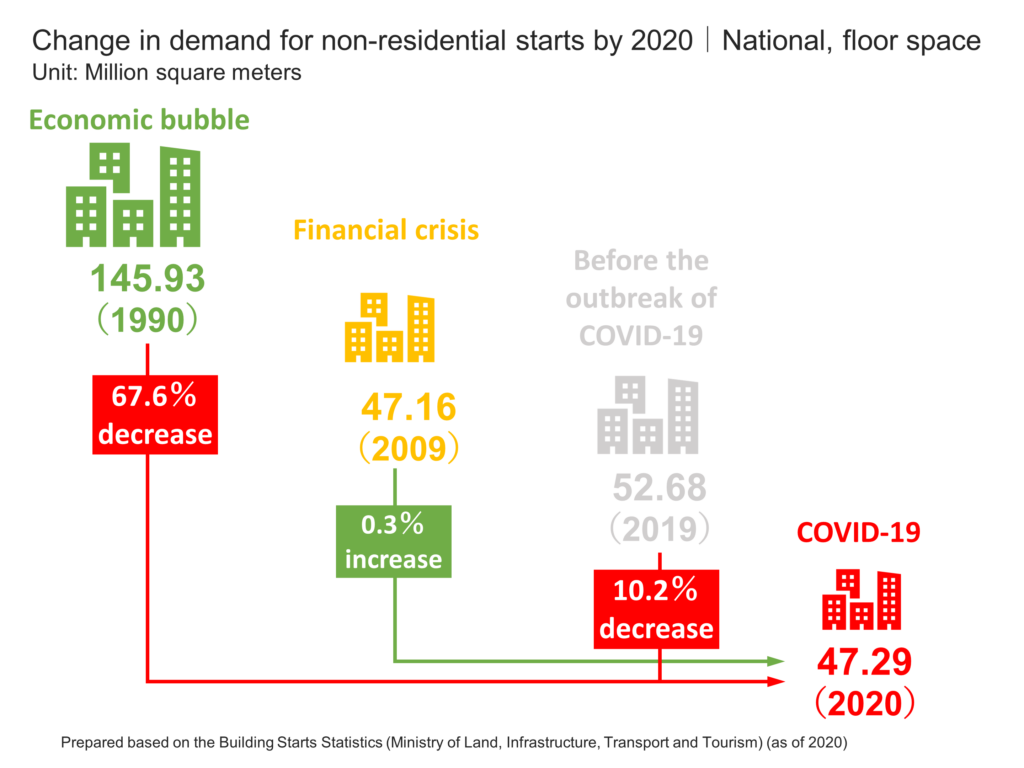
Demand for non-residential starts in Japan was 47.29 million square meters on a floor area basis. This level is slightly higher than the 47.16 million square meters in 2009, the year of the financial crisis, which was the lowest level recorded since the economic bubble.
The level of demand for non-residential starts in 2020 is 67.6% lower, 0.3% higher, and 10.2% lower than the levels recorded during the economic bubble (1990), financial crisis (2009), and before the outbreak of COVID-19 (2019), respectively. (See figure below)
Looking at changes in demand for non-residential starts by use through 2020, we see that demand for office construction has declined by 70%, 11%, and 4%, stores by 65%, 33%, and 10%, and factories by 79%, 10%, 33%, while demand for warehouse construction declined by 34%, increased by 149%, and declined by 26% since the economic bubble, financial crisis, and before the outbreak of COVID-19, respectively. (See figure below)
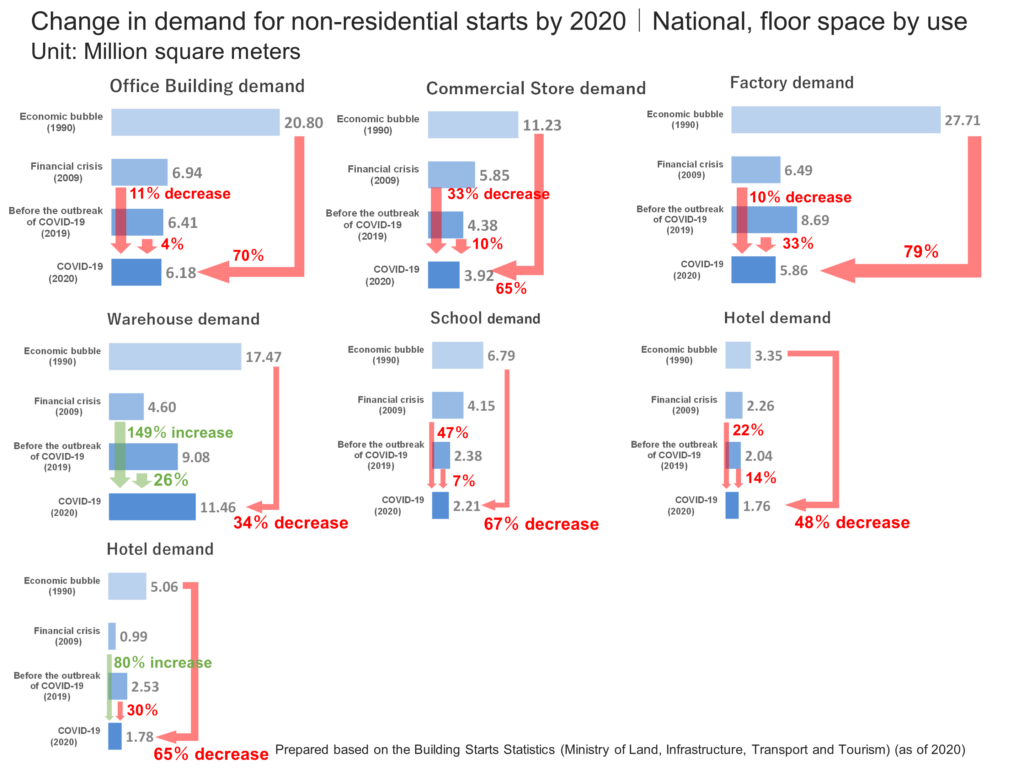
Similarly, we can see that demand for schools has decreased by 67%, 47%, and 7% and hospitals by 48%, 22%, and 14%, while demand for hotels declined by 65%, increased by 80%, and declined by 30% since the economic bubble, financial crisis, and before the outbreak of COVID-19, respectively. (See figure above)
From the above, we can see that demand for non-residential starts by use in 2020 is decreasing from the level of the economic bubble (1990), regardless of the use. On the other hand, there are some uses such as warehouses and hotels that have increased from levels seen during the financial crisis period (2009) and before the outbreak of COVID-19 (2019), indicating that the trend differs by use.
4. Summary
As we have seen, the overall demand for construction starts in 2020 has shrunk to around 40% of the levels seen during the economic bubble (1990) 30 years ago, the lowest level in 54 years since 1966.
As Japan’s population continues to decline and the number of working people and households declines, it is highly likely that demand for building starts will shrink from a broad and long-term perspective.
However, as the results of the aforementioned comparison of changes in demand for construction starts through 2020 indicate, demand for residential starts by use and demand for non-residential starts by use tend to differ depending on the historical background and factors affecting demand at the time.
As mentioned above, this report introduces the demand for building starts in terms of floor space in Japan, from the perspective of overall building starts, residential starts, and non-residential starts.
Reference|Data List
Finally, the following table introduces the data used in this report for reference.
Floor space of building starts in Japan (in million square meters)
| Year | Total building starts | Residential starts | Non-residential starts |
| 1985 | 199.6 | 103.1 | 96.4 |
| 1986 | 207.7 | 111.0 | 96.7 |
| 1987 | 237.2 | 132.5 | 104.7 |
| 1988 | 255.8 | 134.5 | 121.3 |
| 1989 | 269.2 | 135.0 | 134.2 |
| 1990 | 283.4 | 137.5 | 145.9 |
| 1991 | 252.3 | 117.2 | 135.0 |
| 1992 | 246.6 | 120.3 | 126.3 |
| 1993 | 230.7 | 131.7 | 99.0 |
| 1994 | 238.1 | 145.6 | 92.5 |
| 1995 | 228.1 | 136.5 | 91.6 |
| 1996 | 259.8 | 157.9 | 101.9 |
| 1997 | 228.0 | 129.2 | 98.8 |
| 1998 | 196.0 | 111.8 | 84.2 |
| 1999 | 194.3 | 117.9 | 76.3 |
| 2000 | 200.3 | 119.9 | 80.4 |
| 2001 | 181.1 | 109.8 | 71.3 |
| 2002 | 172.3 | 104.8 | 67.6 |
| 2003 | 173.1 | 104.0 | 69.1 |
| 2004 | 181.5 | 105.5 | 76.0 |
| 2005 | 186.1 | 106.6 | 79.5 |
| 2006 | 188.9 | 108.8 | 80.1 |
| 2007 | 161.0 | 90.7 | 70.3 |
| 2008 | 157.4 | 90.8 | 66.6 |
| 2009 | 115.5 | 68.3 | 47.2 |
| 2010 | 121.5 | 72.9 | 48.5 |
| 2011 | 126.5 | 75.4 | 51.2 |
| 2012 | 132.6 | 78.4 | 54.2 |
| 2013 | 147.9 | 87.2 | 60.6 |
| 2014 | 134.0 | 75.7 | 58.3 |
| 2015 | 129.4 | 75.1 | 54.4 |
| 2016 | 133.0 | 78.2 | 54.8 |
| 2017 | 134.7 | 77.5 | 57.2 |
| 2018 | 131.1 | 75.3 | 55.8 |
| 2019 | 127.6 | 74.9 | 52.7 |
| 2020 | 113.7 | 66.5 | 47.3 |
Prepared based on the Building Starts Statistics (Ministry of Land, Infrastructure, Transport and Tourism) (as of 2020)
Comment