Super General Contractors by Business Performance | 2021 edition
In this issue of the “State of General Contractors” series, which provides an overview of the status of Japan’s major general contractors based on their business performance, etc., we will introduce the status of super general contractors.
The status of super general contractors based on business performance
Specifically, the following points will be introduced based on the status and trends of business performance, such as order intake, sales, and carryover balance in the fiscal year ending March 31, 2021.
- Order intake
- Sales
- Carryover balance
- Operating profit and operating profit margin
- Employee status
1. Order intake
The average order intakes of the five super general contractors in FY2020 was 1.2568 trillion yen, a decrease of approximately 2.7% from the previous fiscal year. Orders increased from 1.0388 trillion yen in FY2012 to 1.2272 trillion yen in FY2013, and then hovered around 1.2993 trillion yen from FY2014 to FY2017. (See figure below)
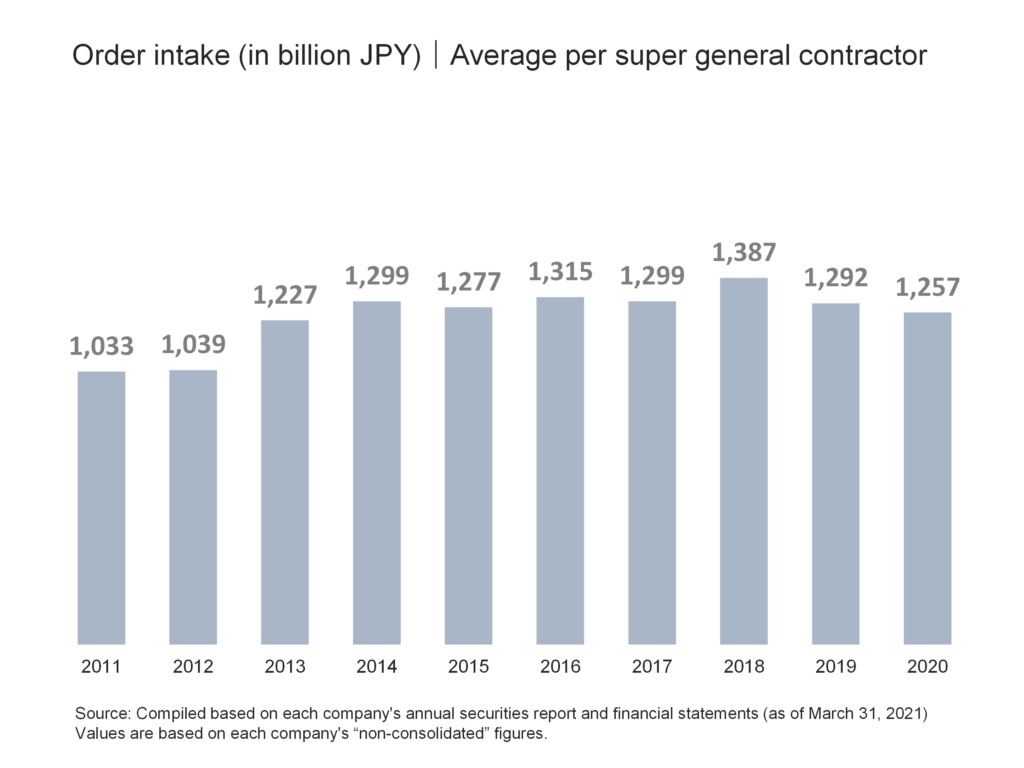
After that, order intake levels reached 1.3874 trillion yen in FY2018, the highest level in the past 10 years, but declined for two consecutive years since FY2019. Although order intakes in FY2020 were about 3% lower than that of the previous year, it was about 22% higher than FY2011, when it bottomed out, indicating that it is still at a high level.
The five super general contractors account for 11.6% of the construction industry as a whole. (See figure below)
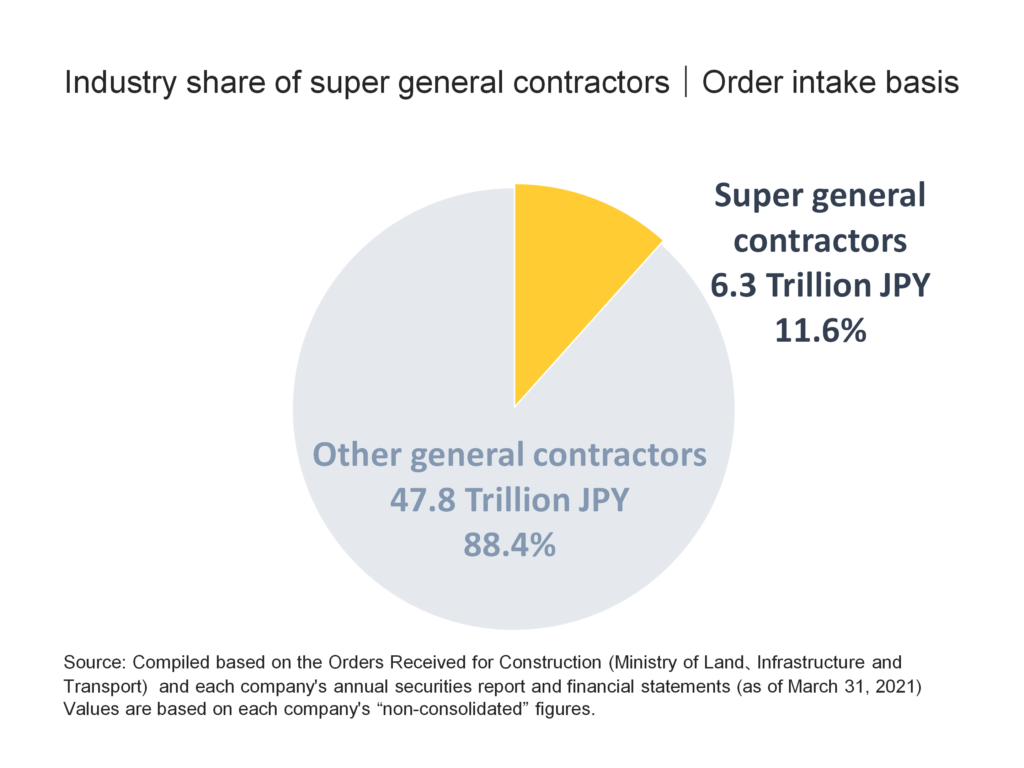
Considering that there are approximately 470,000 construction companies in Japan, the share of the five super general contractors in the industry is extremely large, indicating their strong influence on construction demand.
2. Sales
Next, the average sales amount in FY2020 was 1.1572 trillion yen, a decrease of about 12.4% from the previous year. After an upward trend from 1.017 trillion yen in FY2011 to 1.2079 trillion yen in FY2015, sales declined to 1.1863 trillion yen in FY2016. (See figure below)
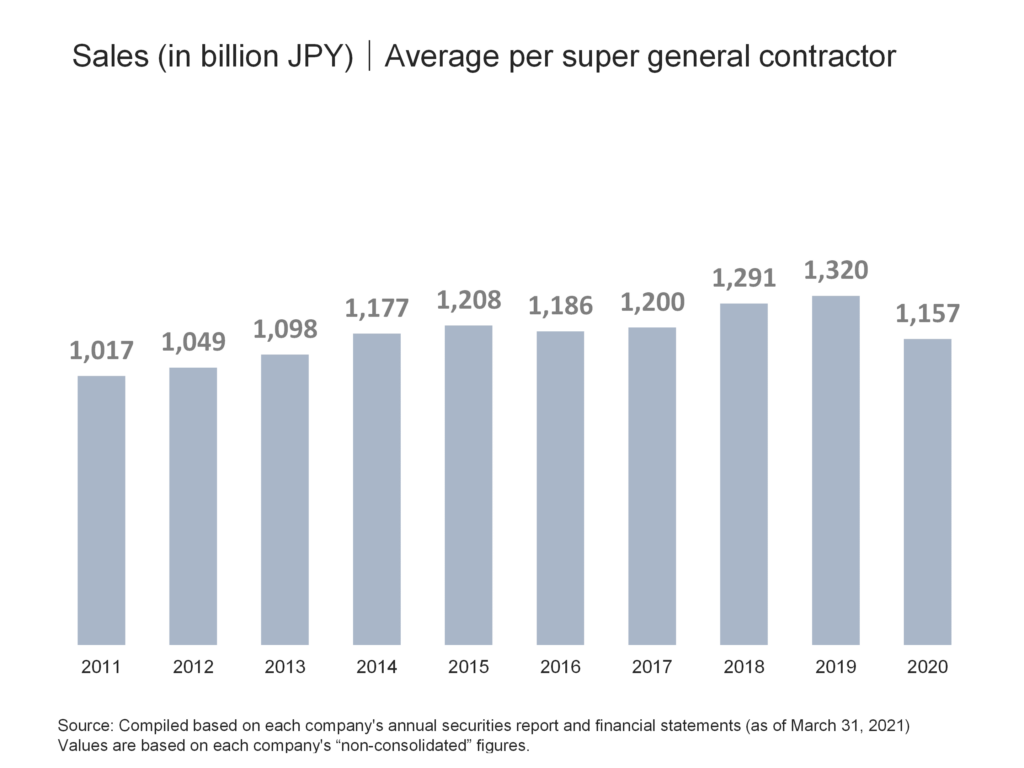
After that, net sales increased for three consecutive years to 1.3205 trillion yen in FY2019, the highest level in the past 10 years, but began to decline in FY2020. Sales in FY2020 are about 13.8% higher than levels recorded in FY2011, when the market bottomed out.
3. Carryover balance
The average carryover balance of super general contractors in FY2020 was 1.9229 trillion yen, an increase of about 5.5% from the previous year. The carry-over amount has been on a continuous upward trend for six consecutive years, from when it bottomed out in FY2012 at 1.2188 trillion yen to FY2018, before decreasing in FY2019 and then increasing again in FY2020. (See figure below)
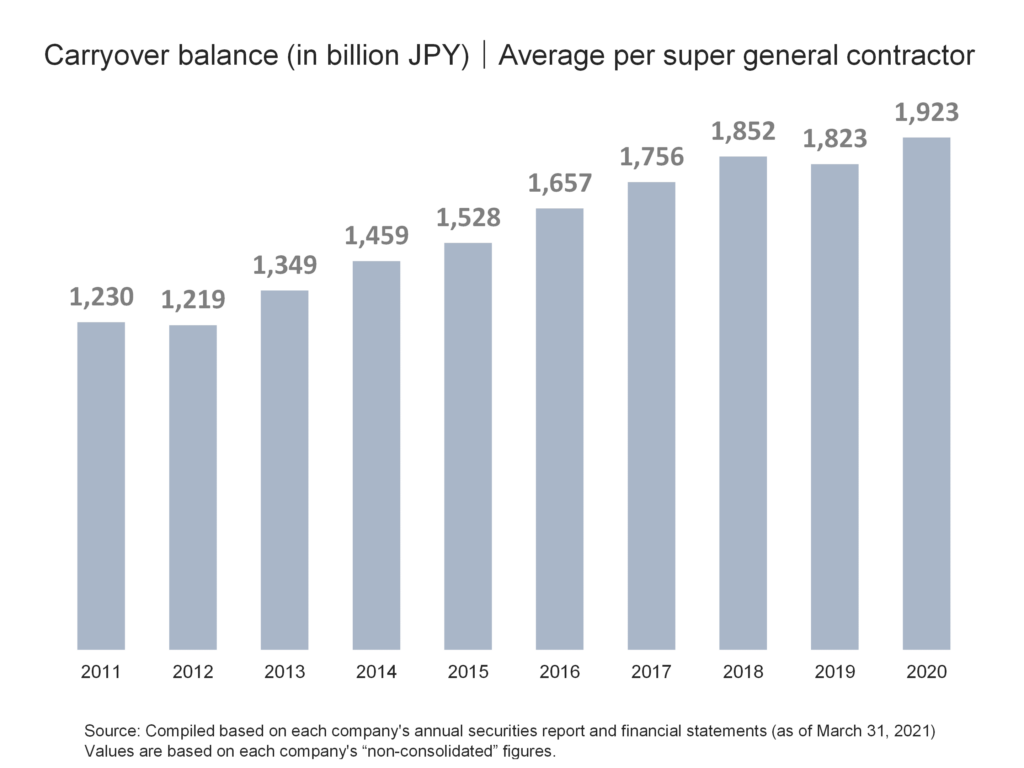
This level of carryover in FY2020 is the highest in the past 10 years, and is 57.8% higher than the level in FY2012, when figures bottomed out.
Here, we will also look at an indicator called the “months of construction at hand,” which indicates the period of time needed to finish the work on hand that construction companies carry-over at the end of the fiscal year.
The number of months of work on hand for super general contractors in FY2020 was 19.9 months, a significant increase of 3.3 months compared to the previous year’s level, and the highest level in the last 10 years. (See figure below)
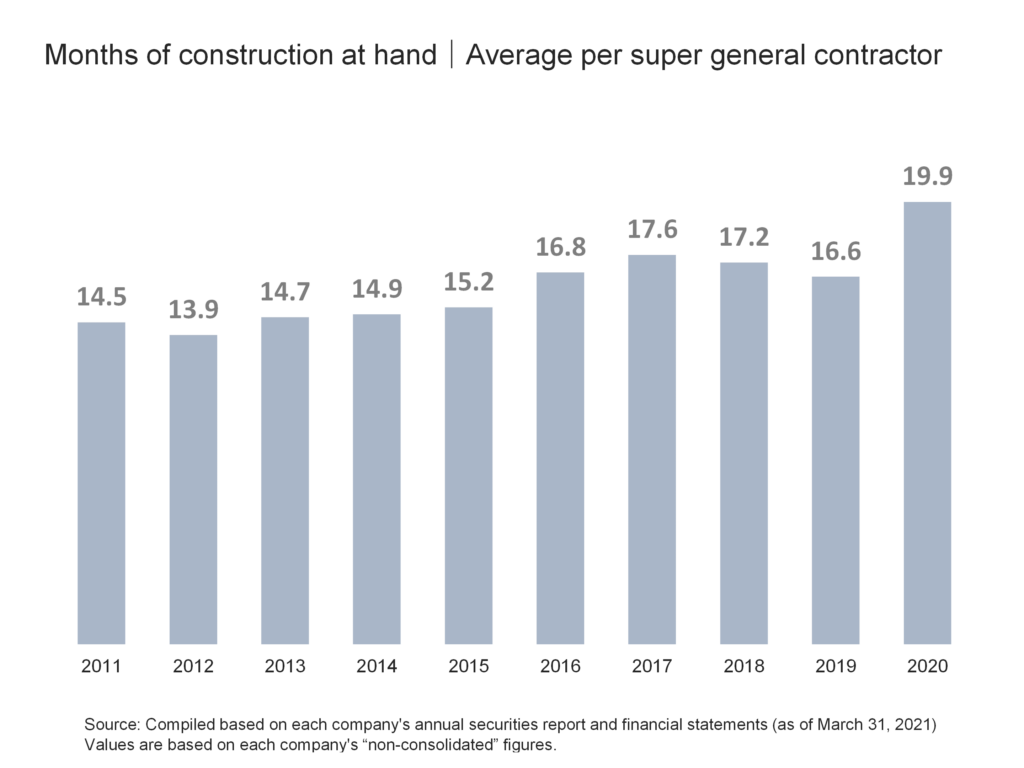
The reason for the large increase in the number of months of work on hand is that the rate of change in the amount of work carried forward was much higher than the rate of change in the amount of sales due to the decrease in sales, in addition to the fact that the amount of work carried forward was at its highest level in the past 10 years.
4. Operating profit and operating profit margin
The operating income of super general contractors in FY2020 was 86.6 billion yen, a decrease of approximately 20.9% from the previous year. Operating income has been on an upward trend for five consecutive years, from 6.7 billion yen in FY2012, when it bottomed out, to 120.7 billion yen in FY2017, but has declined for three consecutive years since FY2018. (See figure below)
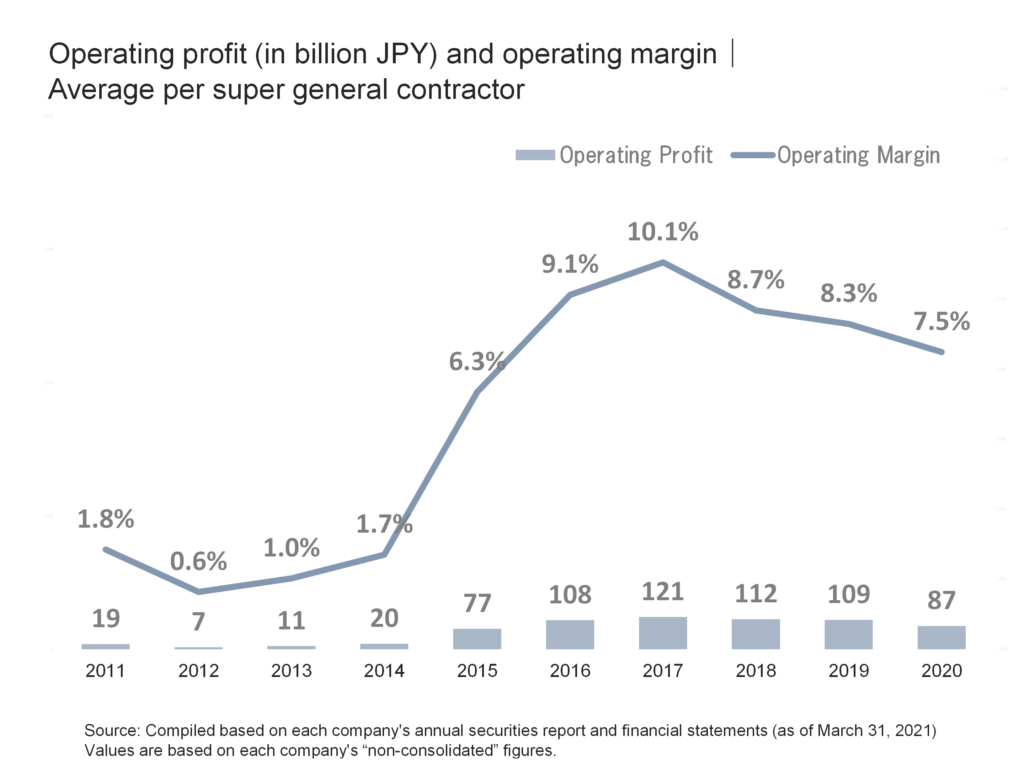
The operating profit margin for FY2020 is 7.5%. The operating profit margin bottomed out in FY2012 and rose for five consecutive years to 10.1% in FY2017, before falling for three consecutive years starting in FY2018.
5. Employee status
The average number of employees of super general contractors in FY2020 was 9,588, indicating that the number of employees has been on a very moderate upward trend for six consecutive years since FY2014. (See figure below)
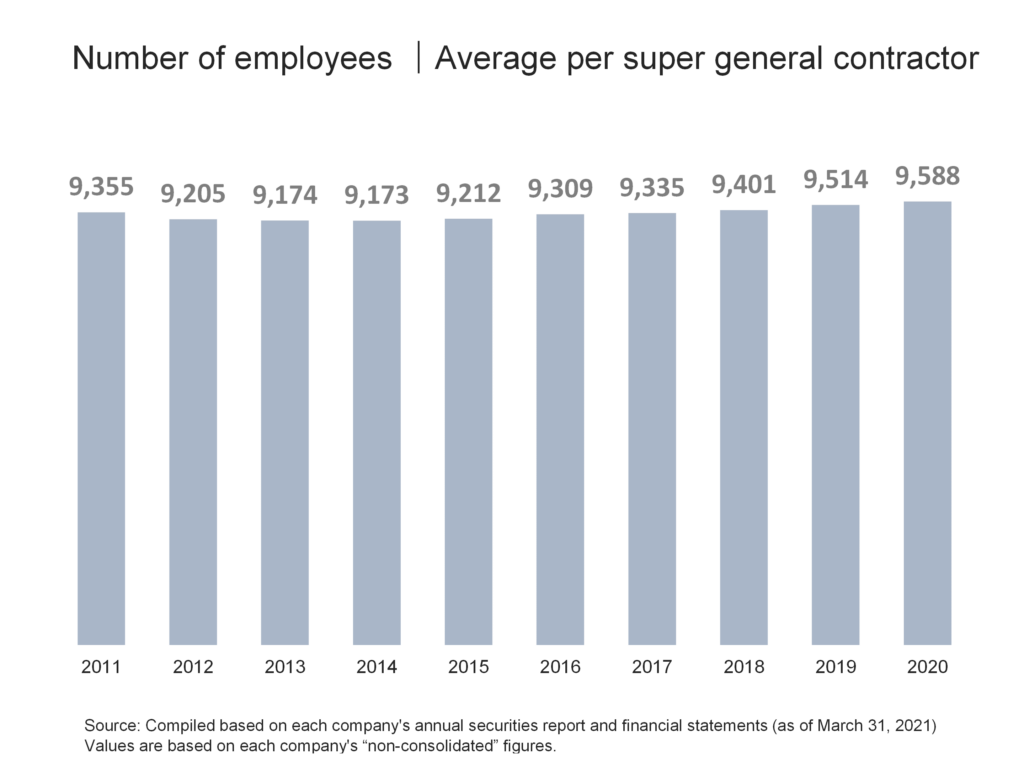
The average age of employees working at super general contractors in FY2019 was 43.2 years, the average length of employment was 17.5 years, and the average annual salary was 10.262 million yen.
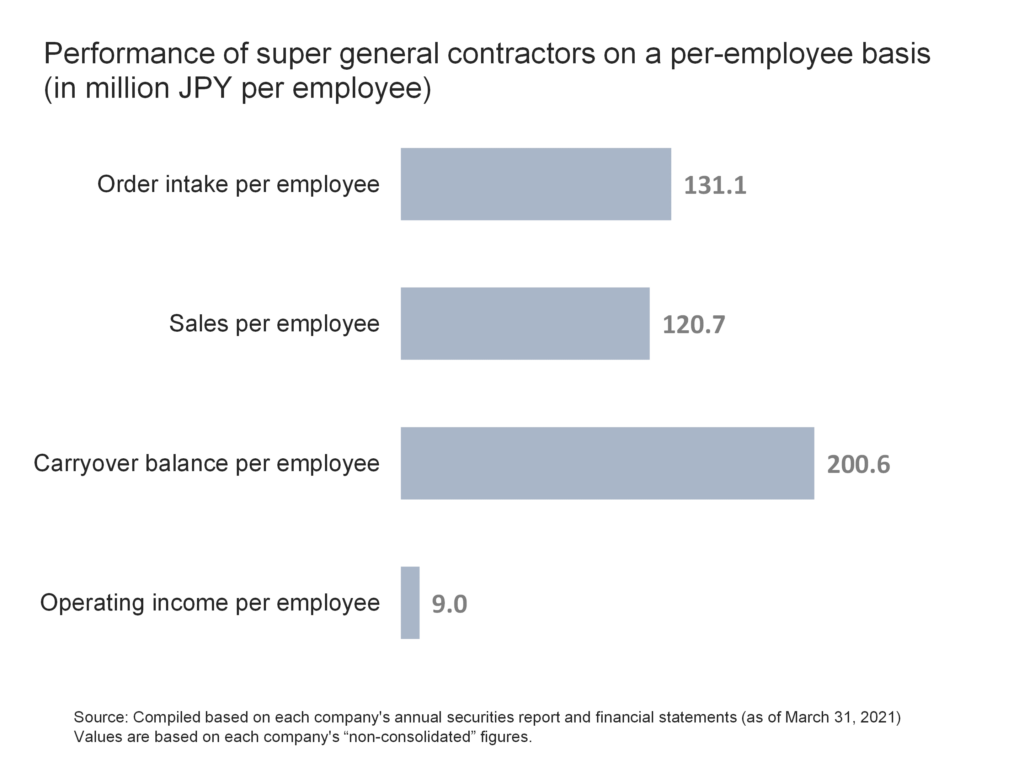
Furthermore, looking at the performance of super general contractors on a per-employee basis, order intake, sales, carry-over balance, and operating income per employee were approximately 131.1 (million yen/person), 120.7 (million yen/person), 200.6 (million yen/person), and 9.0 (million yen/person), respectively. (See figure below)
Reference|Main data list
Finally, a list of key data from the five super general contractors and the data used in the survey is presented below for reference.
list of the 5 super general contractors
| General contractor size | Company |
|---|---|
| Super general contractors | Shimizu Corporation, Taisei Corporation, Obayashi Corporation, Kajima Corporation, Takenaka Corporation |
Data for Super General Contractors in Japan by Business Performance
| item | value | notes |
|---|---|---|
| ① Order intake | 6,284 Billion JPY | Total of 5 super general contractors |
| ② Sales | 5,786 Billion JPY | Total of 5 super general contractors |
| ③ Carryover balance | 9,615 Billion JPY | Total of 5 super general contractors |
| ④ Operating income | 433 Billion JPY | Total of 5 super general contractors |
| ⑤ Operating profit margin | 7.5% | ④÷② |
| ⑥ Number of months of work on hand | 19.9months | ③÷②×12months |
| ⑦ Number of employees | 47,938 | Total of 5 super general contractors |
| ⑧ Average order intake | 1,257 Billion JPY | ①÷5 |
| ⑨ Average sales | 1,157 Billion JPY | ②÷5 |
| ⑩ Average carryover balance | 1,923 Billion JPY | ③÷5 |
| ⑪ Average operating income | 87 Billion JPY | ④÷5 |
| ⑫ Average number of employees | 9,588 | ⑦÷5 |
| ⑬ Average age of employees | 43.2 years | – |
| ⑭ Average length of employment | 17.5 years | – |
| ⑮ Average annual salary | 10.3 Million JPY | – |
| ⑯ Order intake per employee | 13.1 Million JPY per employee | ①÷⑦ |
| ⑰ Sales per employee | 12.1 Million JPY per employee | ②÷⑦ |
| ⑱ Carryover balance per employee | 20.1 Million JPY per employee | ③÷⑦ |
| ⑲ Operating income per employee | 0.9 Million JPY per employee | ④÷⑦ |
Source: Compiled based on each company’s annual securities report and financial statements (as of March 31, 2021) Values are based on each company’s “non-consolidated” figures.
Comment