Mid-sized General Contractors by Business Performance | 2021 edition
In this issue of the “State of General Contractors” series, which provides an overview of the status of Japan’s major general contractors based on their business performance, etc., we will introduce the status of mid-sized general contractors.
Specifically, the following points will be introduced based on the status and trends of business performance, such as order intake, sales, and carryover balance in the fiscal year ending March 31, 2021.
- Order intake
- Sales
- Carryover balance
- Operating profit and operating profit margin
- Employee status
1. Order intake
In FY2020, orders received by the eight mid-sized general contractors averaged 159.2 billion yen, an increase of approximately 5.6% from the previous year. After trending upward from 116.4 billion yen in FY2011 to 162.5 billion yen in FY2014, orders received generally hovered around 150 billion yen from FY2015 to FY2017. (See figure below)
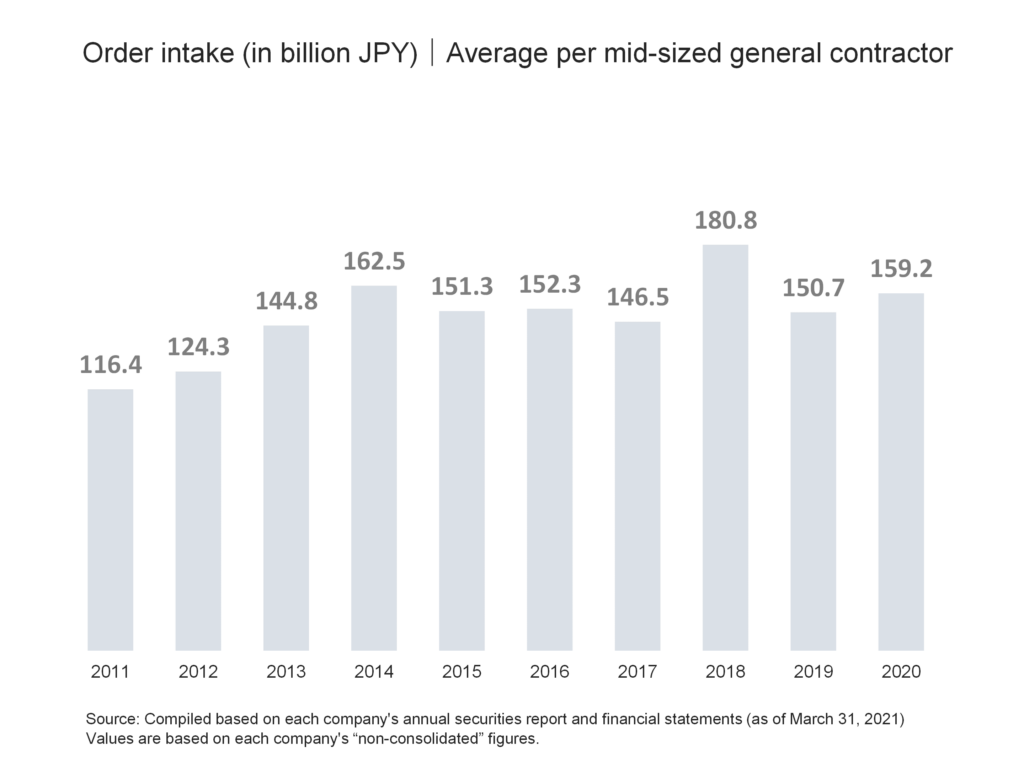
After increasing to 180.8 billion yen in FY2018, the highest level in the past 10 years, the amount decreased to 150.7 billion yen in FY2019, but is expected to increase in FY2020. This level in FY2020 is about 36.8% higher than the level in FY2011, when the market bottomed out.
Looking at the industry share of mid-sized general contractors in terms of orders received, the eight mid-sized general contractors account for 2.4% of the total construction industry. (See figure below)
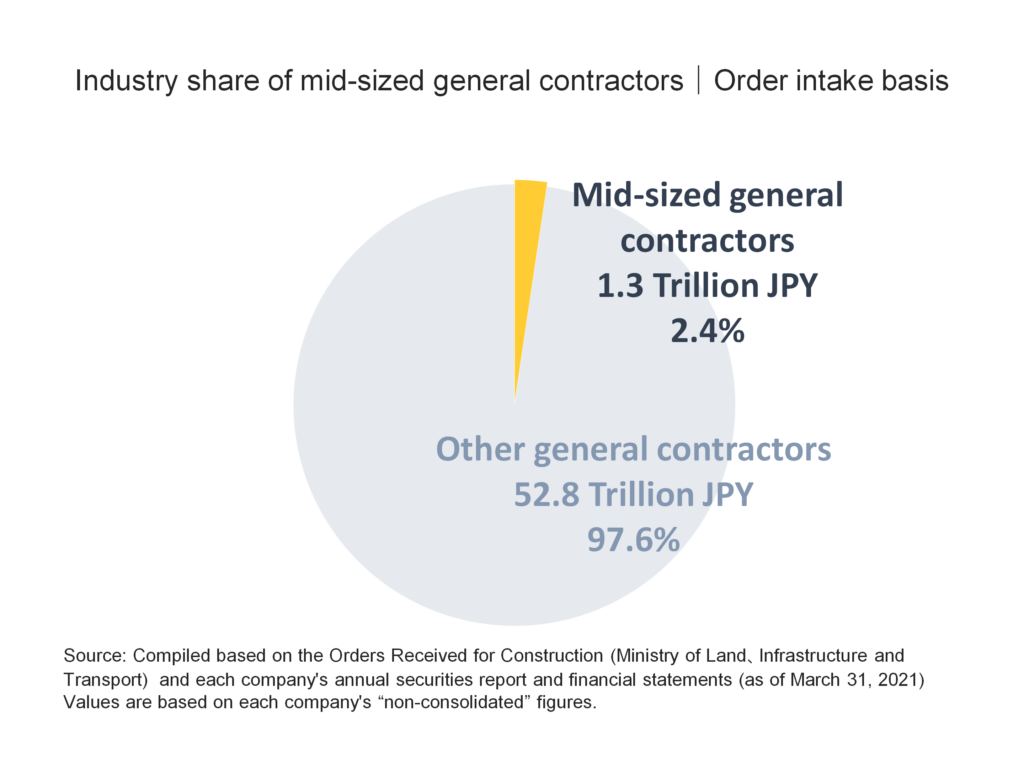
Considering that there are approximately 470,000 construction companies in Japan, the share of the industry accounted for by the eight mid-sized general contractors is not very small, but their influence on construction demand is limited.
2. Sales
The average sales of mid-sized general contractors in FY2020 was 150.3 billion yen, a decrease of about 5.1% from the previous year. Sales were on an upward trend from 122.5 billion yen in FY2011 to 148.2 billion yen in FY2015, and then declined to 139.4 billion yen in FY2016. (See figure below)
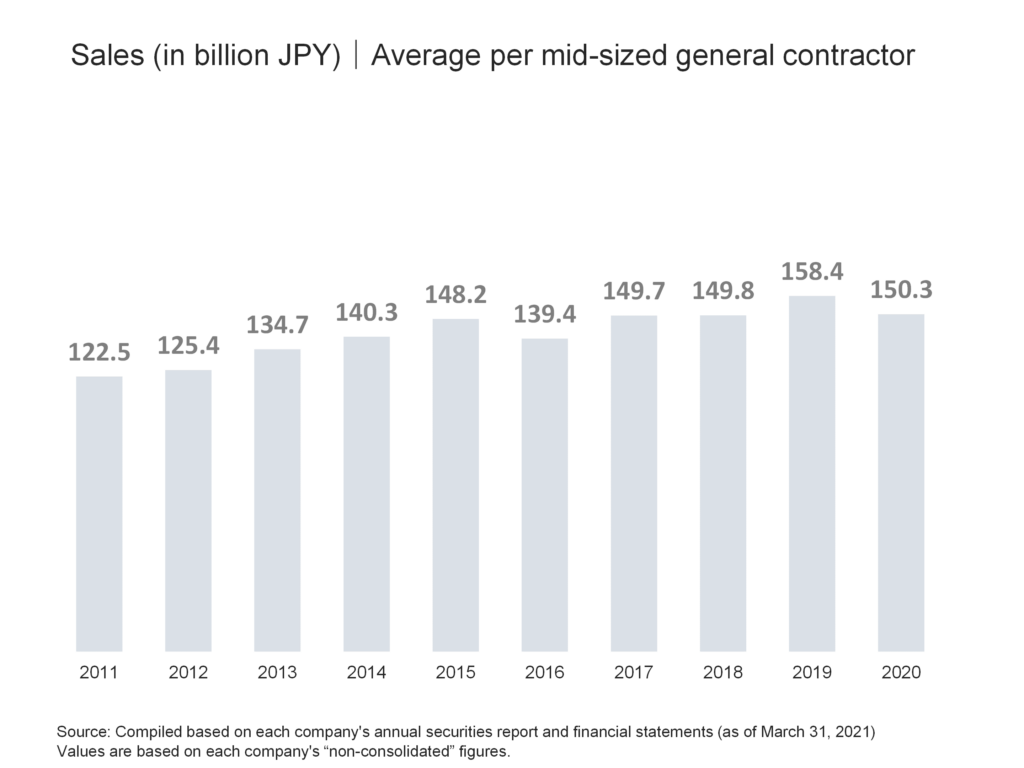
After that, sales were on an increasing trend for three consecutive years, reaching 158.4 billion yen in FY2019, the highest level in the past 10 years, but it is readily apparent that it will begin to decline in FY2020. Comparing the sales in FY2020 to levels in FY2011, when the market bottomed out, we can see that levels are 22.7% higher.
3. Carryover balance
The average amount carried forward by mid-sized general contractors in FY2020 was 221.5 billion yen, an increase of about 4.9% from the previous year. The carryover balance has been on an upward trend for four consecutive years, from 132.9 billion yen in FY2011, when it bottomed out, to 186.9 billion yen in FY2016, but slightly decreased to 185 billion yen in FY2017. (See figure below)
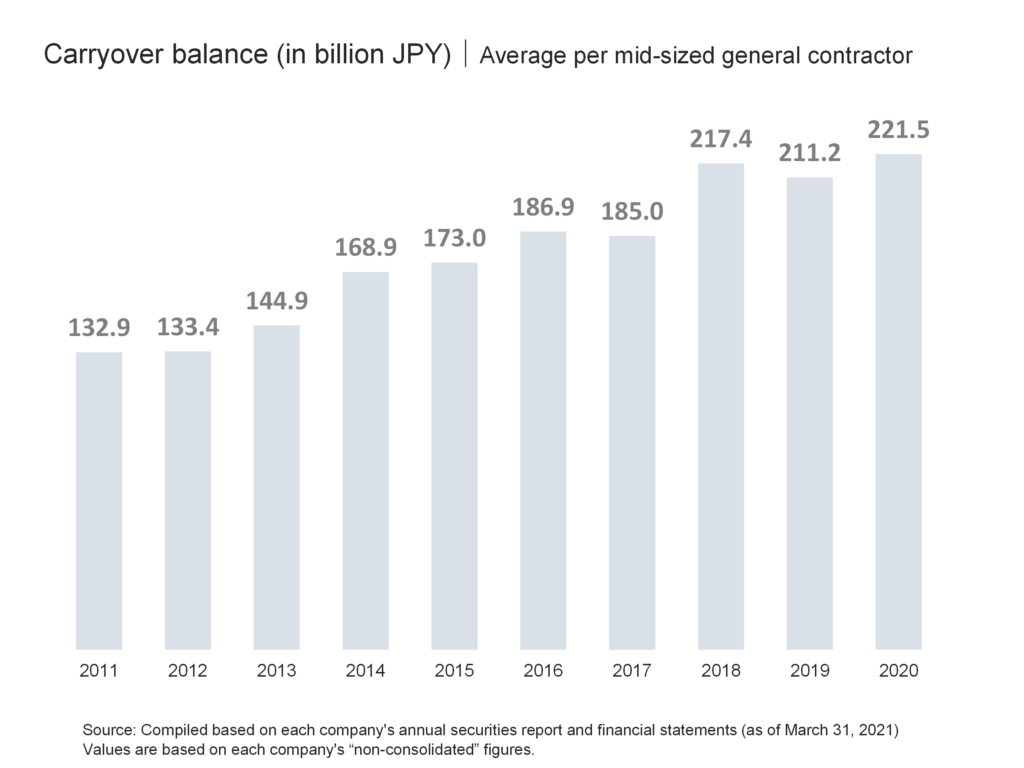
From there, there was a large jump to 217.4 billion yen in FY2018, followed by a decrease in FY2019, but the level in FY2020 was the highest in the past 10 years. In addition, the amount carried forward in FY2020 is about 66.6% higher than the level in FY2011, when the market bottomed out, indicating that the amount of construction work on hand that will be carried forward to the next fiscal year is at a very high level.
This indicates that the amount of work on hand that will be carried over to the next fiscal year is at a very high level. Here, we will also look at an indicator called the “months of construction at hand,” which indicates the period of time needed to finish the work on hand that construction companies carry-over at the end of the year.
In FY2020, the number of months of construction on hand for mid-sized general contractors was 17.7 months. Although the number of months of work on hand decreased from 17.4 months in FY2018 to 16.0 months in FY2019, it was the highest level in the past 10 years in FY2020. (See figure below)

4. Operating profit and operating profit margin
In FY2020, the operating income of mid-sized general contractors was 7.4 billion yen, a slight increase of 200 million yen from 7.2 billion yen in the previous year, while remaining largely unchanged. Operating income has been on an upward trend for six consecutive years, from -600 million yen in FY2011, when it bottomed out, to 8 billion yen in FY2017. Operating income declined for the first time in seven years to 6.9 billion yen in FY2018 but has increased for two consecutive years since then. (See figure below)
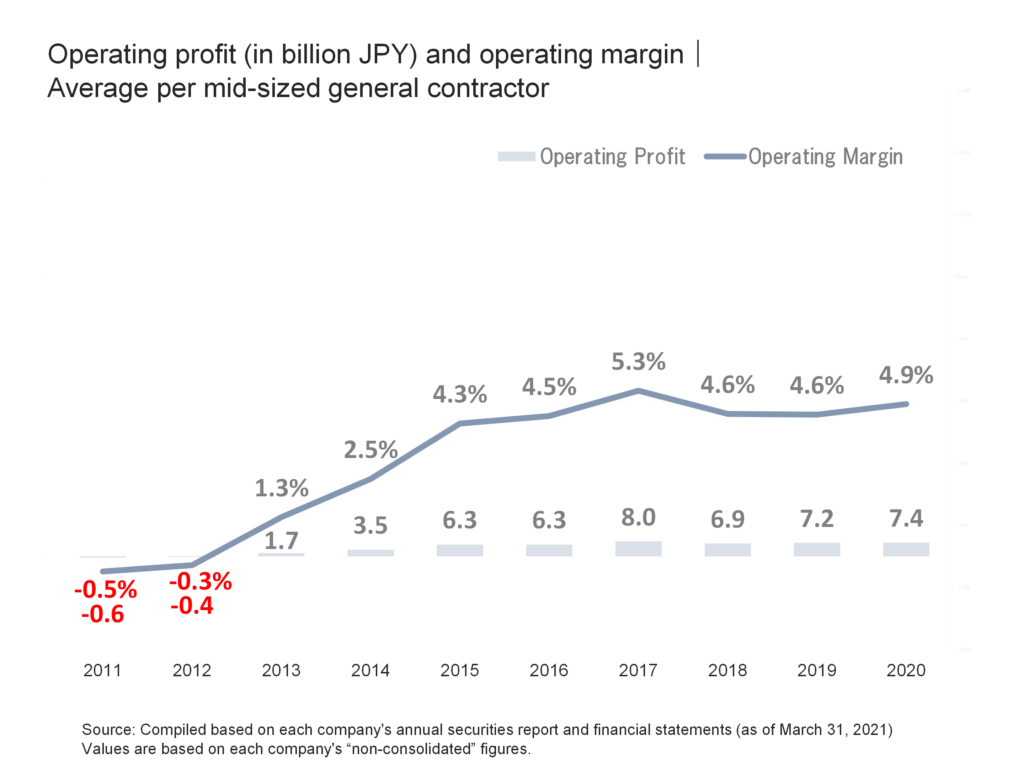
The operating profit margin for FY2020 was 4.9%. The operating margin reflects the trend of operating income, which bottomed out in FY2011, rose for six consecutive years until it reached 5.3% in FY2017, and then declined in FY2018. After that, we can see that the rate remained flat until FY2019, and then rose slightly in FY2020.
5. Employee status
It can be read that the number of employees of mid-sized general contractors in FY2020 is 1554 on average, a very moderate increase for six consecutive years from 1390 in FY2014. (See chart below)
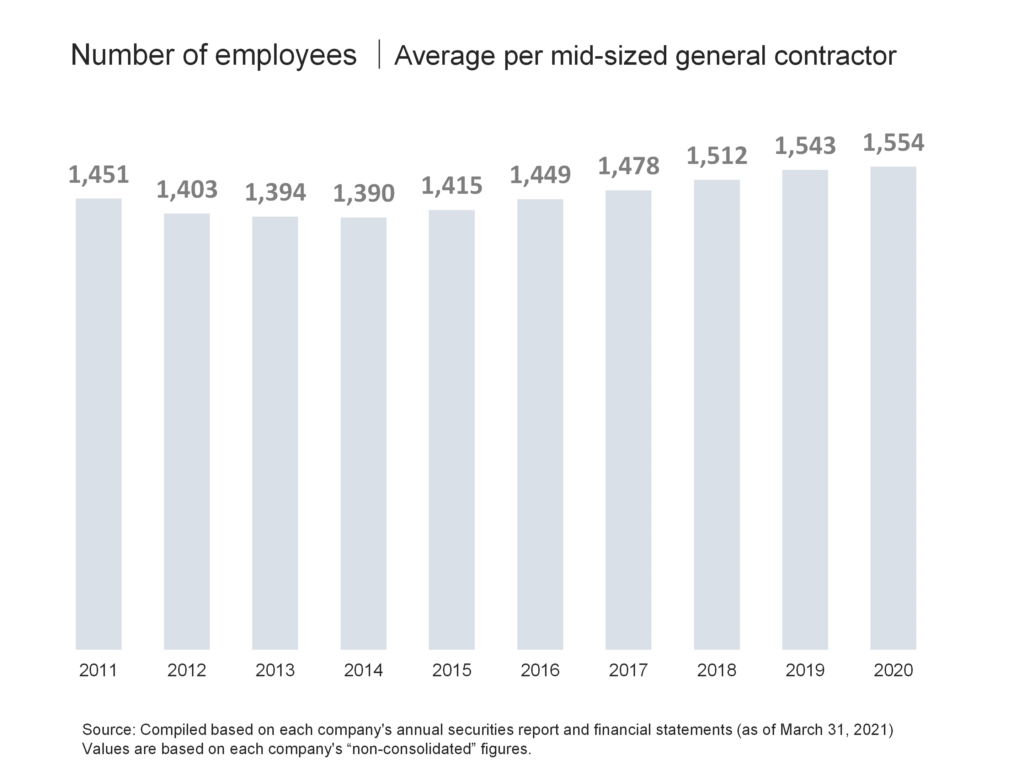
In FY2020, the average age of employees at mid-sized general contractors was 43.4 years old, the average length of service was 17.9 years, and the average annual salary was 8.563 million yen.
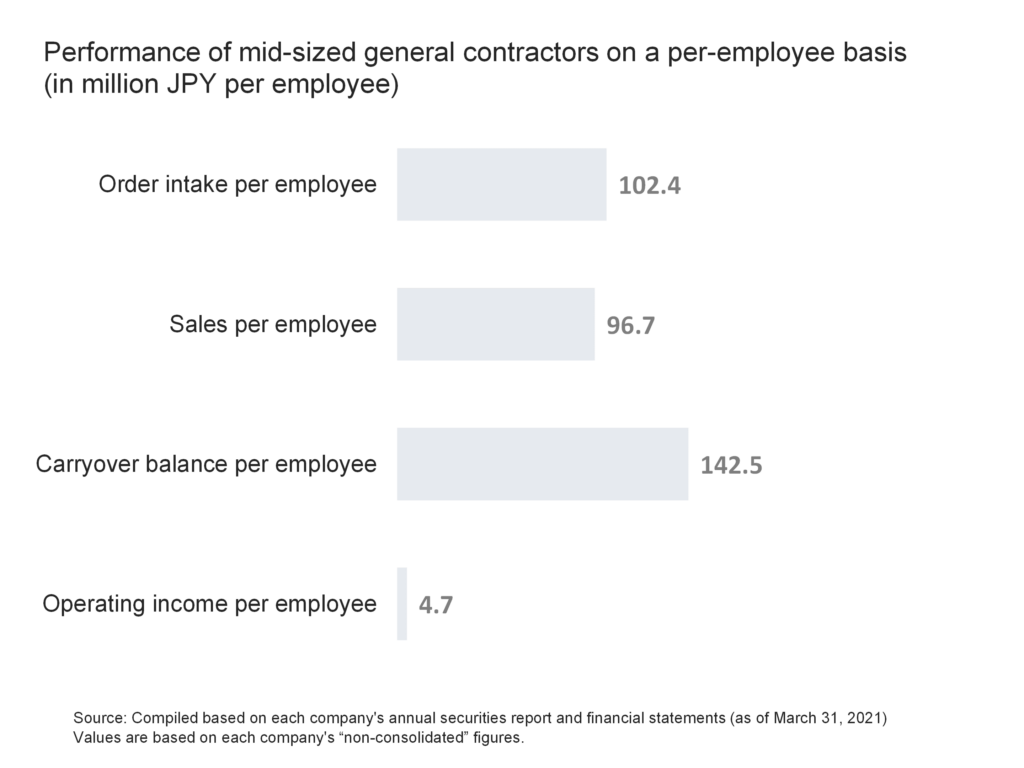
Looking at the performance of mid-sized general contractors on a per-employee basis, order intake, sales, carryover balance, and operating income per employee were approximately 102.4 (million yen/person), 96.7 (million yen/person), 142.5 (million yen/person), and 4.7 (million yen/person), respectively. (See figure below)
Reference|Main data list
Finally, the following is a reference list of the eight mid-sized general contractors and the main data used in the survey.
list of the 8 mid-sized general contractors
Data for Mid-sized General Contractors in Japan by Business Performance
| item | value | notes |
|---|---|---|
| ① Order intake | 1,273 Billion JPY | Total of 8 mid-sized general contractors |
| ② Sales | 1,202 Billion JPY | Total of 8 mid-sized general contractors |
| ③ Carryover balance | 1,772 Billion JPY | Total of 8 mid-sized general contractors |
| ④ Operating income | 59 Billion JPY | Total of 8 mid-sized general contractors |
| ⑤ Operating profit margin | 4.9% | ④÷② |
| ⑥ Number of months of work on hand | 17.7 months | ③÷②×12months |
| ⑦ Number of employees | 12,431 | Total of 8 mid-sized general contractors |
| ⑧ Average order intake | 159 Billion JPY | ①÷8 |
| ⑨ Average sales | 150 Billion JPY | ②÷8 |
| ⑩ Average carryover balance | 221 Billion JPY | ③÷8 |
| ⑪ Average operating income | 7 Billion JPY | ④÷8 |
| ⑫ Average number of employees | 1,554 | ⑦÷8 |
| ⑬ Average age of employees | 43.4 years | – |
| ⑭ Average length of employment | 17.9 years | – |
| ⑮ Average annual salary | 8.56 Million JPY | – |
| ⑯ Order intake per employee | 10.2 Million JPY per employee | ①÷⑦ |
| ⑰ Sales per employee | 9.7 Million JPY per employee | ②÷⑦ |
| ⑱ Carryover balance per employee | 14.3 Million JPY per employee | ③÷⑦ |
| ⑲ Operating income per employee | 0.5 Million JPY per employee | ④÷⑦ |
Source: Compiled based on each company’s annual securities report and financial statements (as of March 31, 2021) Values are based on each company’s “non-consolidated” figures.
Comment