23 Major General Contractors in Japan by Business Performance | 2021 edition
In this issue of the “State of General Contractors” series, which provides an overview of the status of Japan’s major general contractors based on their business performance, etc., we will introduce the status of 23 major general contractors.
Specifically, the following points will be introduced based on the status and trends of business performance, such as order intake, sales, and carryover balance in the fiscal year ending March 31, 2021.
- Order intake
- Sales
- Carryover balance
- Operating profit and operating profit margin
- Employee status
1. Order intake
In FY2020, order intakes of the 23 largest general contractors averaged 489.3 billion yen, a decrease of approximately 2.3% from the previous year. Orders received had been on an upward trend from 385.8 billion yen in FY2011 to 514.7 billion yen in FY2014, before decreasing to 494.2 billion yen in FY2015. (See figure below)
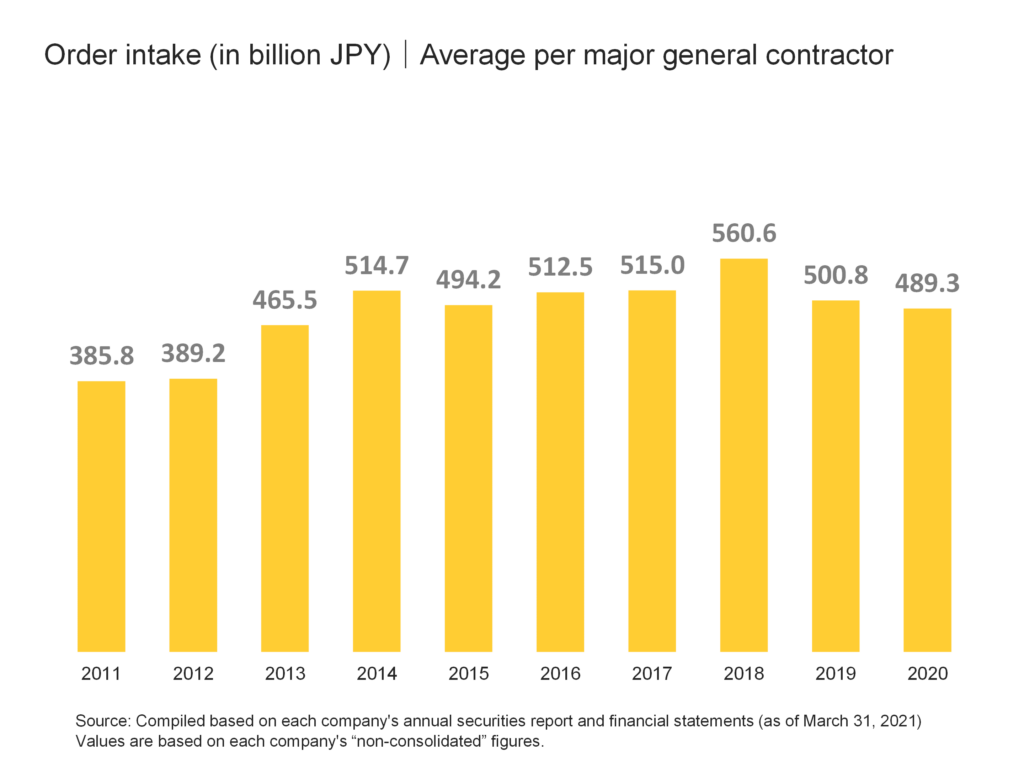
After that, it remained flat at about 510 billion yen from FY2016 to FY2017, and increased to 560.6 billion yen in FY2018, the highest level in the last nine years, but has decreased for two consecutive years since FY2019. In addition, this level in FY2020 is about 26.8% higher than the level in FY2011, when the market bottomed out.
The 23 largest general contractors account for 20.8% of the total construction industry, which is more than 20% of the industry’s market share in terms of orders received. (See figure below)
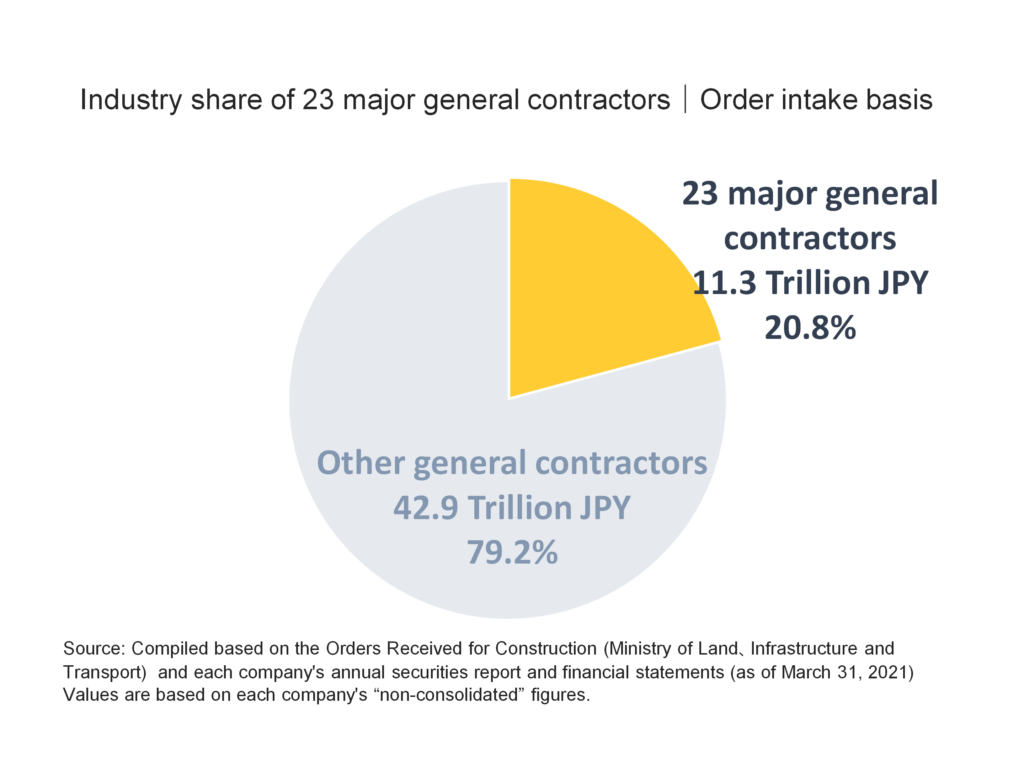
Given the fact that there are approximately 470,000 construction companies in Japan, the 23 major general contractors account for a very large share of the industry and have a very strong influence on construction demand.
2. Sales
The average sales of the 23 largest general contractors in FY2020 was 468 billion yen, a decrease of about 11.5% from the previous year. After an upward trend from 390.5 billion yen in FY2011 to 475 billion yen in FY2015, net sales declined to 464.5 billion yen in FY2016. (See figure below)
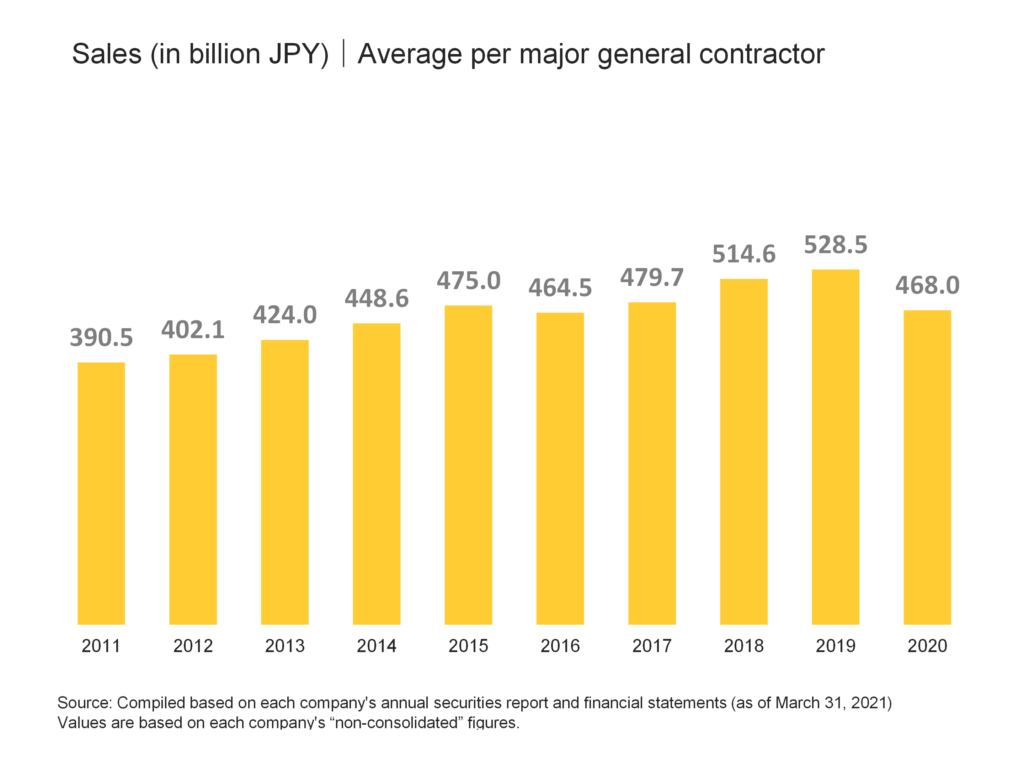
After that, sales have been on an upward trend for three consecutive years, reaching 528.5 billion yen in FY2019, the highest level in the past 10 years, but are expected to decline in FY2020. In addition, sales in FY2020 are about 19.8% higher than levels in FY2011, when the market bottomed out.
3. Carryover balance
The average amount carried forward by the 23 major general contractors in FY2020 was 754.8 billion yen, an increase of about 4.1% from the previous year. The amount carried forward has been on a steady upward trend for six consecutive years, from 445.2 billion yen in FY2012, when it bottomed out, to 743.7 billion yen in FY2018. (See figure below)
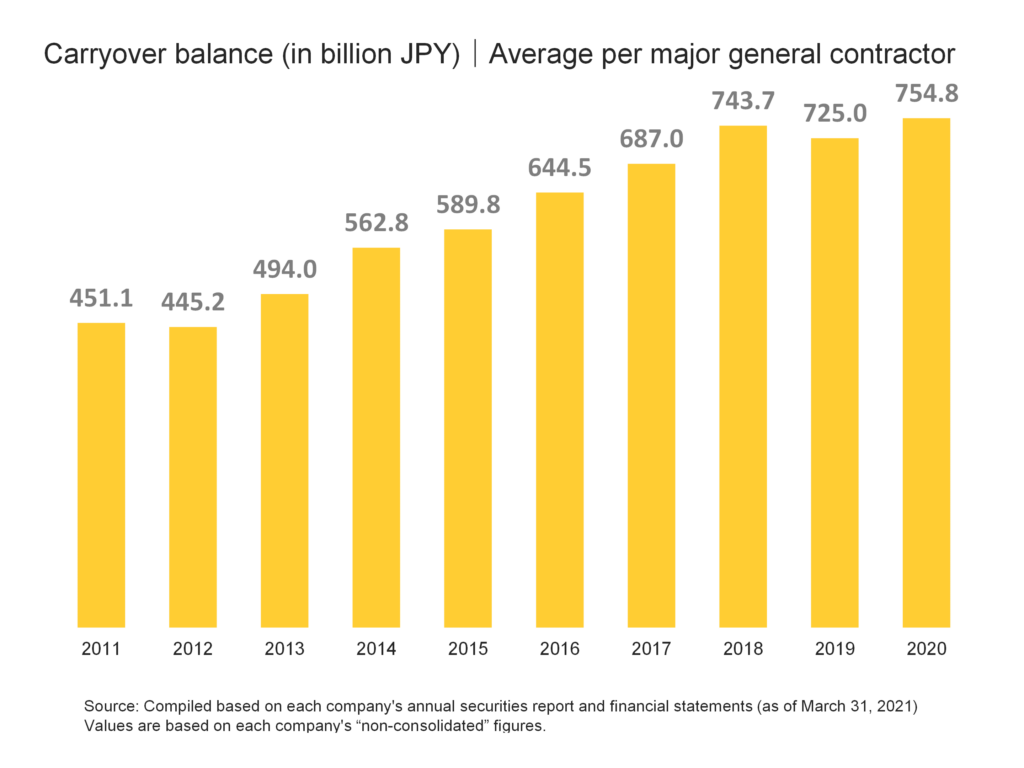
In FY2019, the balance began declining for the first time in seven years, but in FY2020, they increased again, reaching the highest levels in the past 10 years. This means that the amount of construction work on hand that will be carried over to the next fiscal year is at a very high level.
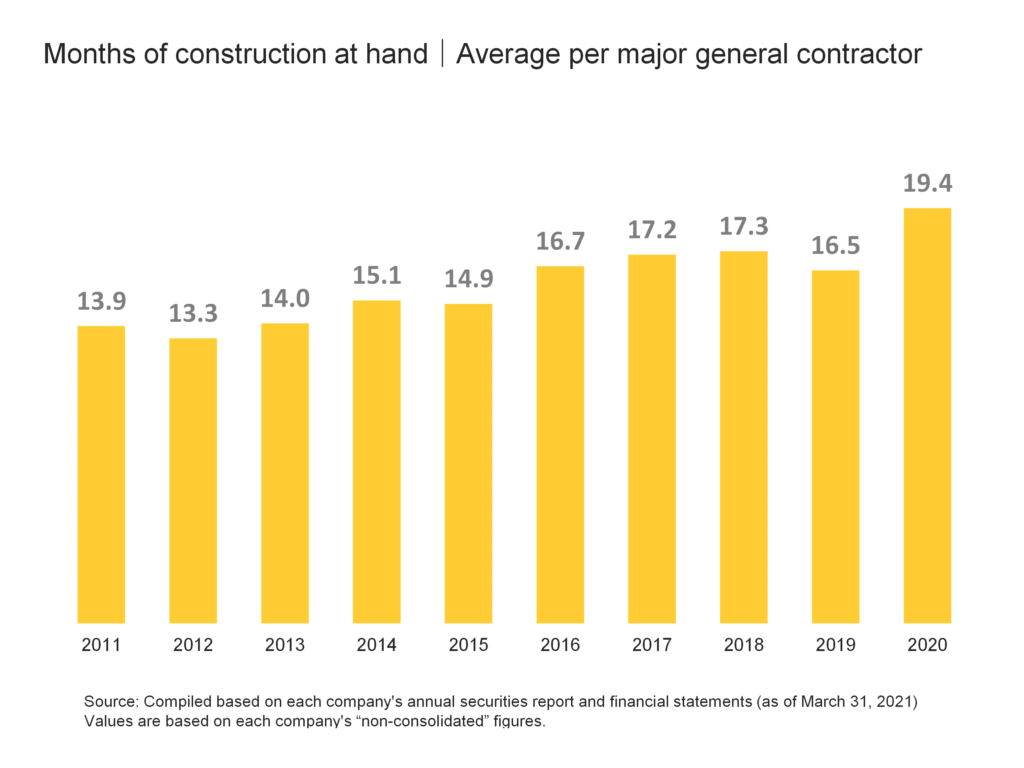
Here, we will also look at an indicator called the “months of construction at hand,” which indicates the period of time needed to finish the work on hand that construction companies carry-over at the end of the year.
The number of months of work on hand for the 23 largest general contractors in FY2020 was 19.4 months. Although the number of months of work on hand decreased from 17.3 months in FY2018 to 16.5 months in FY2019, the level in FY2020 is the highest in the past 10 years. (See figure below)
4. Operating profit and operating profit margin
The operating income of the 23 largest general contractors in FY2020 was 31.4 billion yen, a decrease of approximately 17.8% from the previous year. Operating profit has been on an upward trend for five consecutive years, from -0.3 billion yen in FY2012, when it bottomed out, to 42.5 billion yen in FY2017, but it has declined for three consecutive years since FY2018. However, it can be said that the level in FY2020, although on a downward trend, is still at a high level. (See figure below)
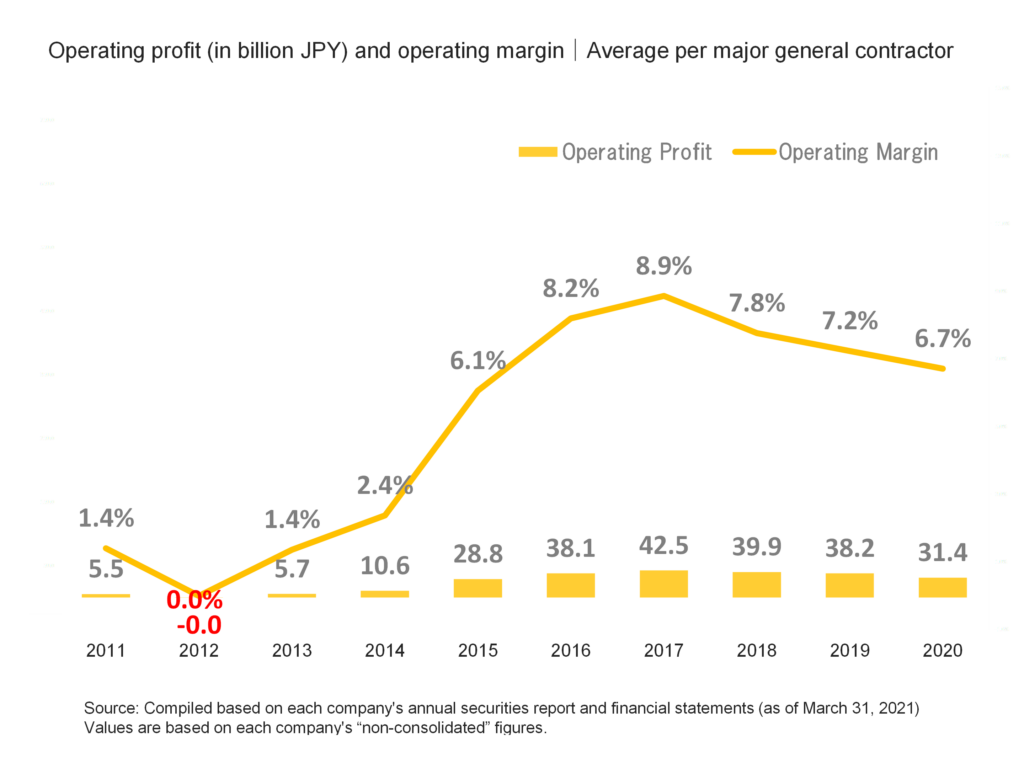
The operating profit margin of the 23 largest general contractors in FY2020 was 6.7%, a decline of 0.5% from the previous year. The operating profit margin, which reflects changes in operating profit, bottomed out in FY2012, rose for five consecutive years to 8.9% in FY2017, and then declined for three consecutive years starting in FY2018
5. Employee status
The average number of employees of the 23 major general contractors in FY2020 is 4,192, which is an increase for seven consecutive years from 3,674 in FY2013. (See figure below)
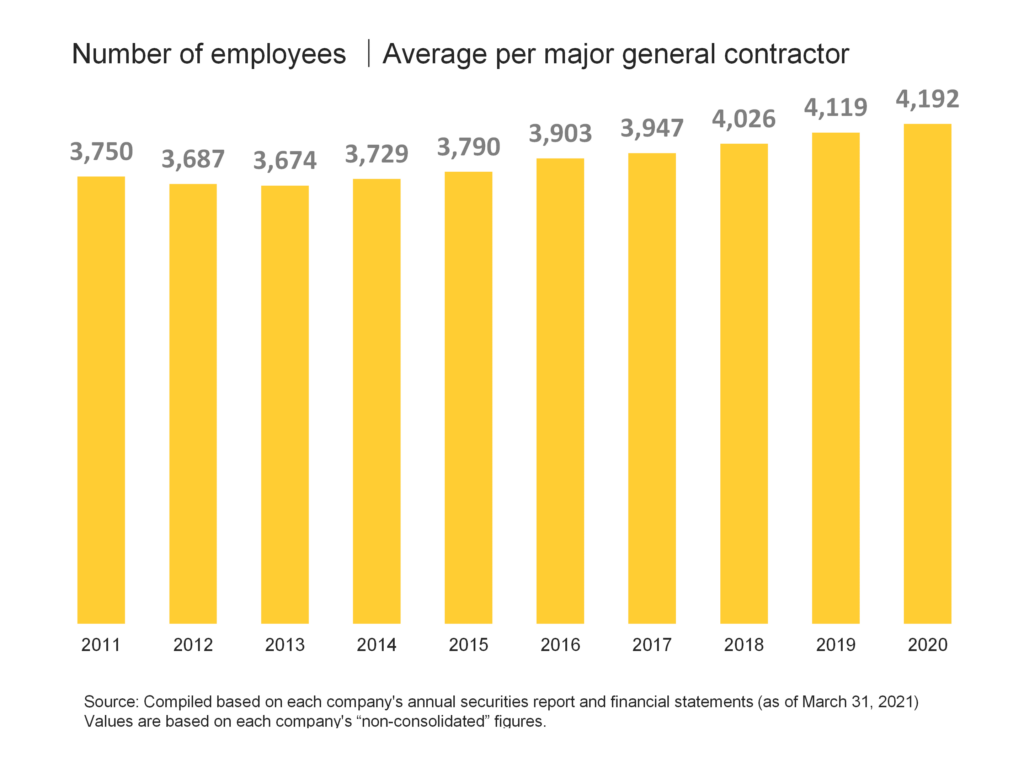
The average age of employees in the 23 major general contractors in FY2020 was 43.4 years, the average length of employment was 17.8 years, and the average annual salary was 9.464 million yen.
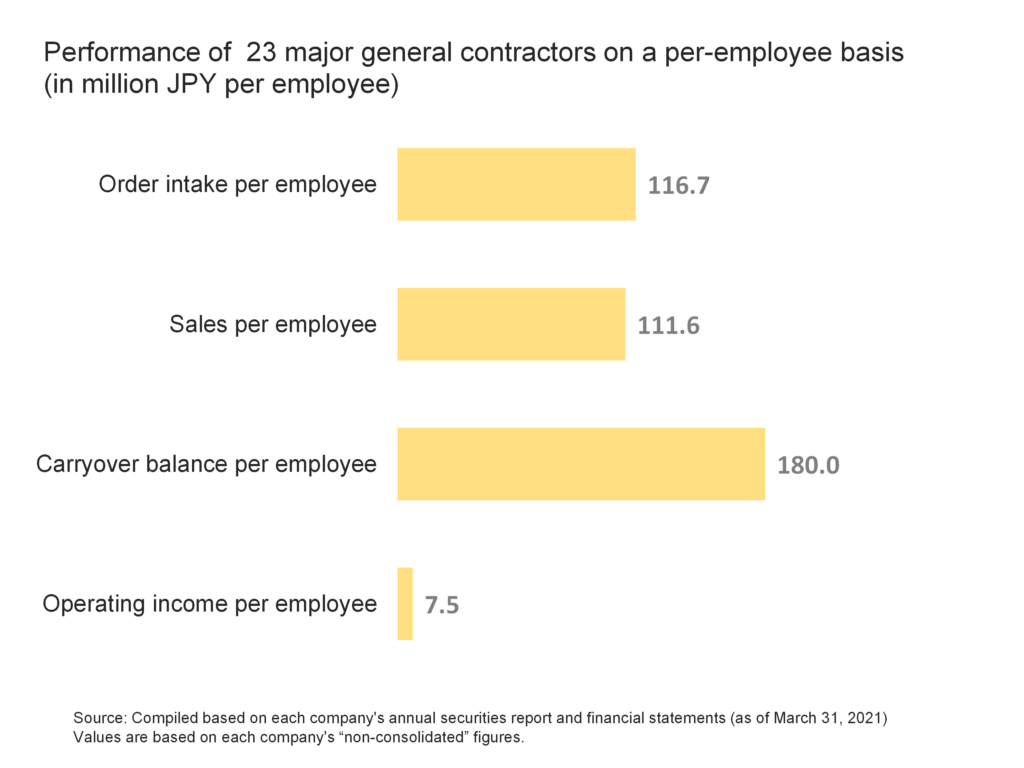
Looking at the performance of mid-sized general contractors on a per-employee basis, order intake, sales, carryover balance, and operating income per employee were approximately 116.7 (million yen/person), 111.6 (million yen/person), 180.0 (million yen/person), and 7.5 (million yen/person), respectively. (See the figure below)
Reference|Main data list
Lastly, the following is a list of the 23 major general contractors and the data used for reference.
list of the 23 major general contractors
Data for 23 Major General Contractors in Japan by Business Performance
| item | value | notes |
|---|---|---|
| ① Order intake | 11.3 trillion JPY | Total of 23 major general contractors |
| ② Sales | 10.8 trillion JPY | Total of 23 major general contractors |
| ③ Carryover balance | 17.4 trillion JPY | Total of 23 major general contractors |
| ④ Operating income | 722 Billion JPY | Total of 23 major general contractors |
| ⑤ Operating profit margin | 6.7% | ④÷② |
| ⑥ Number of months of work on hand | 19.4 months | ③÷②×12months |
| ⑦ Number of employees | 96,422 | Total of 23 major general contractors |
| ⑧ Average order intake | 489 Billion JPY | ①÷23 |
| ⑨ Average sales | 468 Billion JPY | ②÷23 |
| ⑩ Average carryover balance | 755 Billion JPY | ③÷23 |
| ⑪ Average operating income | 31 Billion JPY | ④÷23 |
| ⑫ Average number of employees | 4,192 | ⑦÷23 |
| ⑬ Average age of employees | 43.4 years | – |
| ⑭ Average length of employment | 17.8 years | – |
| ⑮ Average annual salary | 9.46 Million JPY | – |
| ⑯ Order intake per employee | 116.7 Million JPY per employee | ①÷⑦ |
| ⑰ Sales per employee | 111.6 Million JPY per employee | ②÷⑦ |
| ⑱ Carryover balance per employee | 180.0 Million JPY per employee | ③÷⑦ |
| ⑲ Operating income per employee | 7.5 Million JPY per employee | ④÷⑦ |
Source: Compiled based on each company’s annual securities report and financial statements (as of March 31, 2021) Values are based on each company’s “non-consolidated” figures.
Comment