Operating Profit Ranking of 23 Major General Contractors|2021 edition
In this issue of the “State of General Contractors” series, which provides an overview of the status of Japan’s major general contractors based on their business performance, etc., we will introduce the operating profit rankings of the 23 major general contractors based on the operating profit of each company in the fiscal year ending on March 31, 2021.
Considering the fact that general contractors are generally classified according to their company size, we will introduce the following in detail.
- Operating profit ranking of the 23 major general contractors
- Operating profit ranking of super general contractors
- Operating profit ranking of semi-major general contractors
- Operating profit ranking of mid-sized general contractors
- Operating profit comparison by general contractor size
1. Operating profit ranking of the 23 major general contractors
First, among the 23 major general contractors, Taisei Corporation was the general contractor with the largest operating profit at JPY 109.7 billion. Kajima Corporation, Obayashi Corporation, and Shimizu Corporation followed Taisei Corporation with operating profits of JPY 105.1 billion, JPY 93.4 billion, and JPY 90.1 billion, respectively. (See figure below)
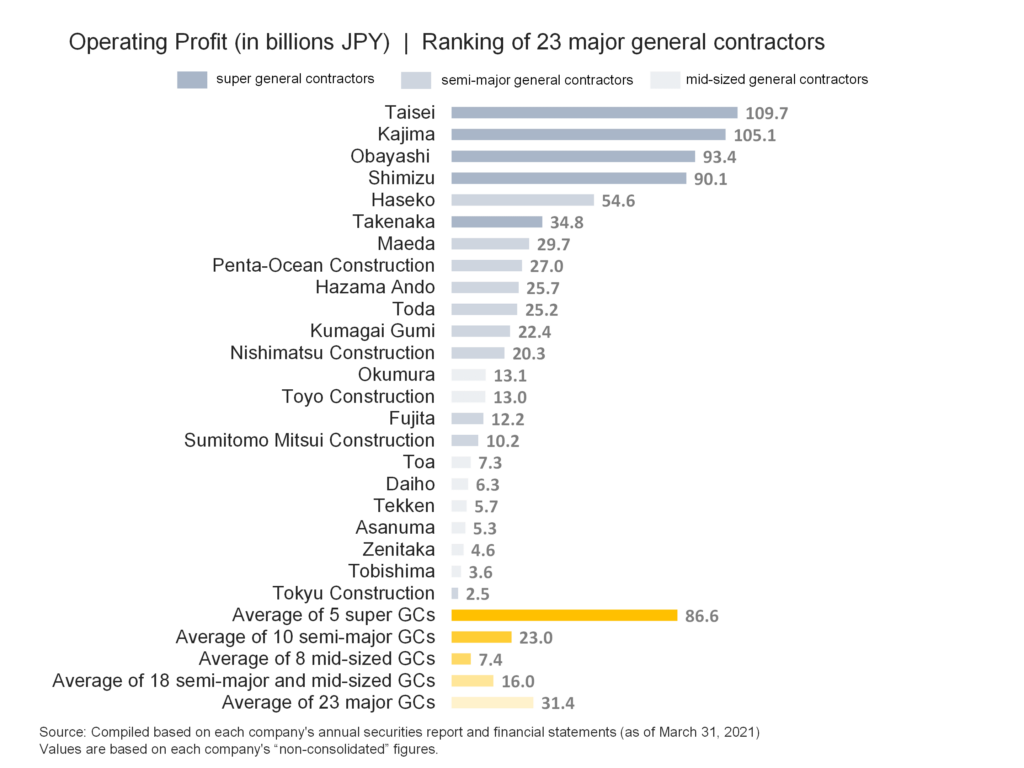
On the other hand, the general contractor with the lowest operating profit was Tokyu Construction Co., Ltd. at JPY 2.5 billion, followed by Tobishima Corporation, the Zenitaka Corporation, and Asanuma Corporation, which had operating profits of JPY 3.6 billion, JPY 4.6 billion, and JPY 5.3 billion, respectively. This suggests that there is a very large difference of about JPY 100 billion when compared to the top general contractors. The average for the 23 companies was JPY 31.4 billion.
2. Operating profit ranking of super general contractors
Next, when looking at the five super general contractors, Taisei Corporation was the super general contractor with the highest operating profit at JPY 109.7 billion. This was followed by Kajima Corporation, Obayashi Corporation, Shimizu Corporation, and Takenaka Corporation, which had operating profits of JPY 105.1 billion, JPY 93.4 billion, JPY 90.1 billion, and JPY 34.8 billion, respectively. (See figure below)
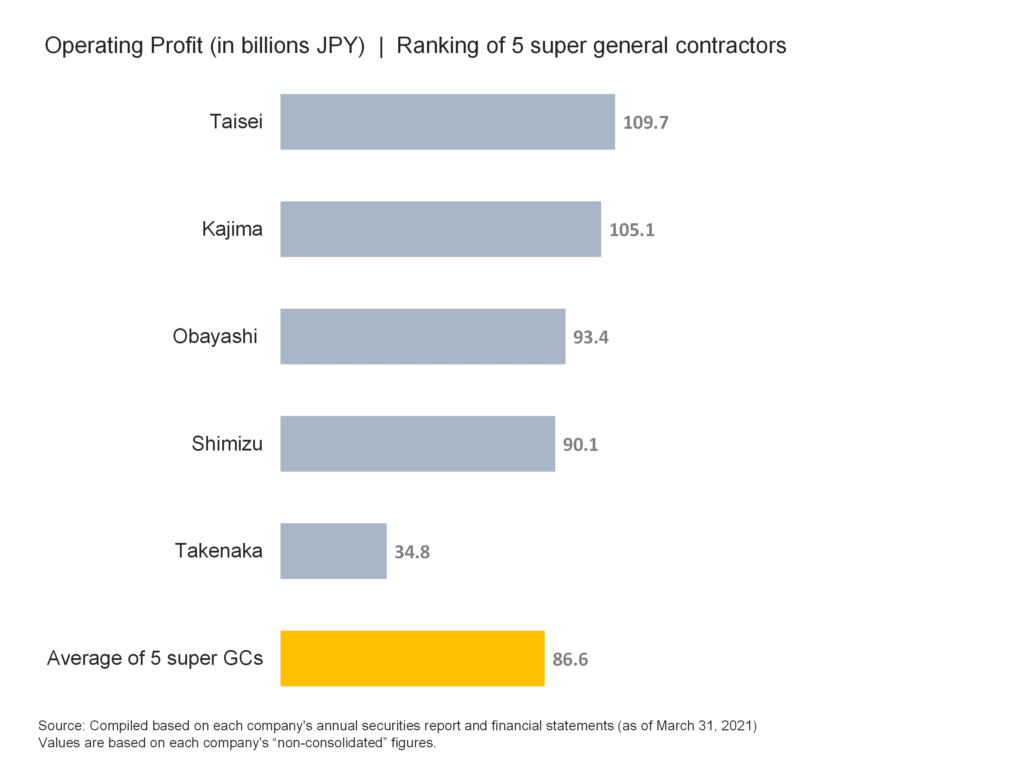
The difference in the operating profit between Taisei Corporation and Takenaka Corporation is approximately JPY 75 billion, indicating that there is a significant difference that is around three-fold in the operating profit, even among super general contractors. The average of the five super general contractors is JPY 86.6 billion, which is an amount that is close to the operating profit recorded by Shimizu Corporation.
3. Operating profit ranking of semi-major general contractors
Next, a look at the operating profits of the 10 semi-major general contractors shows that Haseko Corporation is the semi-major general contractor with the largest operating profit at JPY 54.6 billion. Maeda Corporation, Penta-Ocean Construction Co., Ltd., Hazama Ando Corporation, and Toda Corporation followed with operating profits of JPY 29.7 billion, JPY 27 billion, JPY 25.7 billion, and JPY 25.2 billion, respectively. (See figure below)
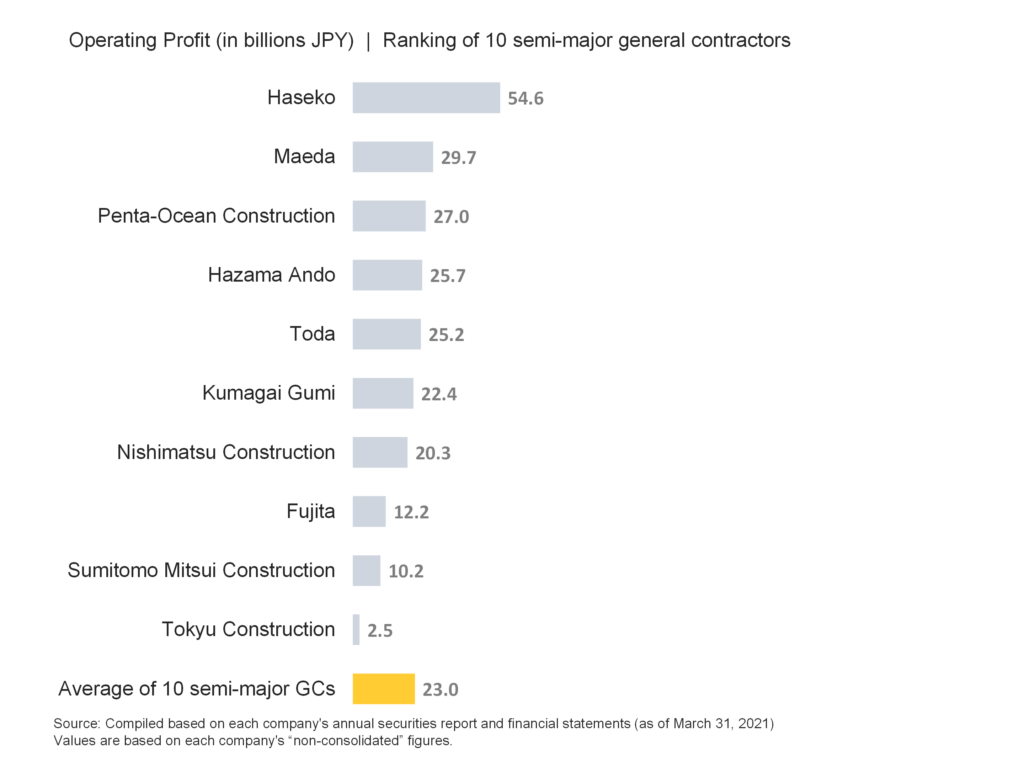
On the other hand, Tokyu Construction Co., Ltd. was the mid-sized general contractor with lowest operating profit at JPY 2.5 billion. Sumitomo Mitsui Construction Co., Ltd., Fujita Corporation, Nishimatsu Construction Co., Ltd., and Kumagai Gumi followed with JPY 10.2 billion, JPY 12.2 billion, JPY 20.3 billion, and JPY 22.4 billion, respectively. The average for the semi-major general contractors was about JPY 23 billion, which is an amount between the operating profits recorded by Toda Corporation and Kumagai Gumi.
4. Operating profit ranking of mid-sized general contractors
Furthermore, looking at the eight mid-sized general contractors, the general contractor with the largest operating profit was Okumura Corporation with JPY 13.1 billion. This was followed by Toyo Construction Co., Ltd., Toa Corporation, and Daiho Corporation, with operating profits of JPY 13 billion, JPY 7.3 billion, and JPY 6.3 billion, respectively. (See figure below)
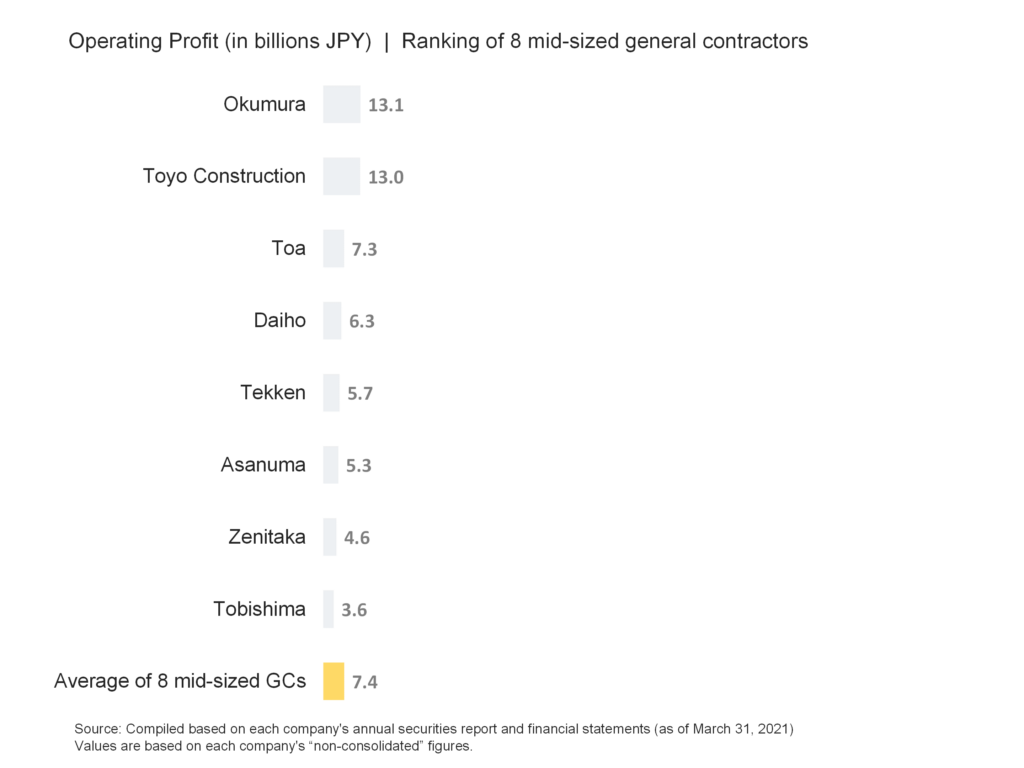
On the other hand, Tobishima Corporation was the mid-sized general contractor with lowest operating profit at JPY 3.6 billion. The Zenitaka Corporation, Asanuma Corporation, and Tekken Corporation followed with JPY 4.6 billion, JPY 5.3 billion, and JPY 5.7 billion, respectively. The average for the mid-sized general contractors was about JPY 7.4 billion, which is an amount between the operating profits of Toyo Construction Co., Ltd. and Toa Corporation.
5. Operating profit comparison by general contractor size
The average operating profit recorded by the five super general contractors is JPY 86.6 billion. The average operating profit recorded by the 10 semi-major general contractors is JPY 23 billion. The average operating profit recorded by the eight mid-sized general contractors is JPY 7.4 billion. This indicates the scale of super general contractors is about 3.8 times larger than that of semi-major general contractors and about 11.7 times larger than that of mid-sized general contractors in terms of average operating profit. (See figure below)
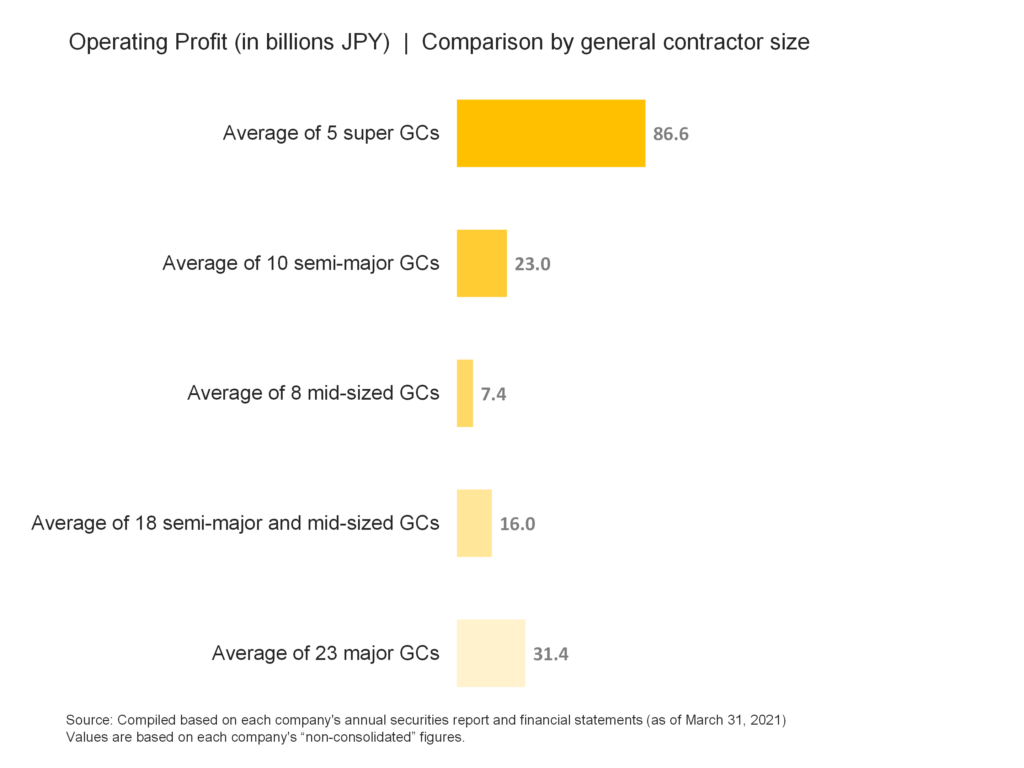
From the same perspective, the size of semi-major general contractors is about 3.1 times larger than that of mid-sized general contractors. The average of the 18 semi-major and mid-sized general contractors and 23 major general contractors was JPY 16 billion and JPY 31.4 billion, respectively.
Reference | Data List
Lastly, the following is a list of the 23 major general contractors and the data used for reference.
list of the 23 major general contractors
Data of Operating Profit Ranking for 23 Major General Contractors
| Company | Operating Profit (in billions JPY) | General contractor size |
|---|---|---|
| Taisei | 109.7 | super general contractors |
| Kajima | 105.1 | super general contractors |
| Obayashi | 93.4 | super general contractors |
| Shimizu | 90.1 | super general contractors |
| Haseko | 54.6 | semi-major general contractors |
| Takenaka | 34.8 | super general contractors |
| Maeda | 29.7 | semi-major general contractors |
| Penta-Ocean Construction | 27.0 | semi-major general contractors |
| Hazama Ando | 25.7 | semi-major general contractors |
| Toda | 25.2 | semi-major general contractors |
| Kumagai Gumi | 22.4 | semi-major general contractors |
| Nishimatsu Construction | 20.3 | semi-major general contractors |
| Okumura | 13.1 | mid-sized general contractors |
| Toyo Construction | 13.0 | mid-sized general contractors |
| Fujita | 12.2 | semi-major general contractors |
| Sumitomo Mitsui Construction | 10.2 | semi-major general contractors |
| Toa | 7.3 | mid-sized general contractors |
| Daiho | 6.3 | mid-sized general contractors |
| Tekken | 5.7 | mid-sized general contractors |
| Asanuma | 5.3 | mid-sized general contractors |
| Zenitaka | 4.6 | mid-sized general contractors |
| Tobishima | 3.6 | mid-sized general contractors |
| Tokyu Construction | 2.5 | semi-major general contractors |
| Average of 5 super GCs | 86.6 | 5 super GCs |
| Average of 10 semi-major GCs | 23.0 | 10 semi-major GCs |
| Average of 8 mid-sized GCs | 7.4 | 8 mid-sized GCs |
| Average of 18 semi-major and mid-sized GCs | 16.0 | 18 semi-major and mid-sized GCs |
| Average of 23 major GCs | 31.4 | 23 major GCs |
Source: Compiled based on each company’s annual securities report and financial statements (as of March 31, 2021) Values are based on each company’s “non-consolidated” figures.
Comment