Semi-Major and Mid-sized General Contractors by Business Performance | 2021 edition
In this issue of the “State of General Contractors” series, which provides an overview of the status of Japan’s major general contractors based on their business performance, etc., we will introduce the status of semi-major and mid-sized general contractors.
Specifically, the following points will be introduced based on the status and trends of business performance, such as order intake, sales, and carryover balance in the fiscal year ending March 31, 2021.
- Order intake
- Sales
- Carryover balance
- Operating profit and operating profit margin
- Employee status
1. Order intake
In FY2020, orders received by the 18 semi-major and mid-sized general contractors averaged 276.1 billion yen, a slight decrease of approximately 1.8% from the previous year. Order intake had been on an upward trend from 205.9 billion yen in FY2011 to 296.7 billion yen in FY2014, and then declined to 276.8 billion yen in FY2015. (See figure below)

After that, it has been on an upward trend for three consecutive years since FY2016, reaching 330.9 billion yen in FY2018, the highest level in the past 10 years, but has been on a downward trend for two consecutive years since FY2019. In addition, levels in FY2020 were about 34.1% higher than levels in FY2011, when the market bottomed out.
Looking at the industry share of semi-major and mid-sized general contractors in terms of orders received, the 18 semi-major and mid-sized general contractors account for 9.2% of the total construction industry. (See chart below)
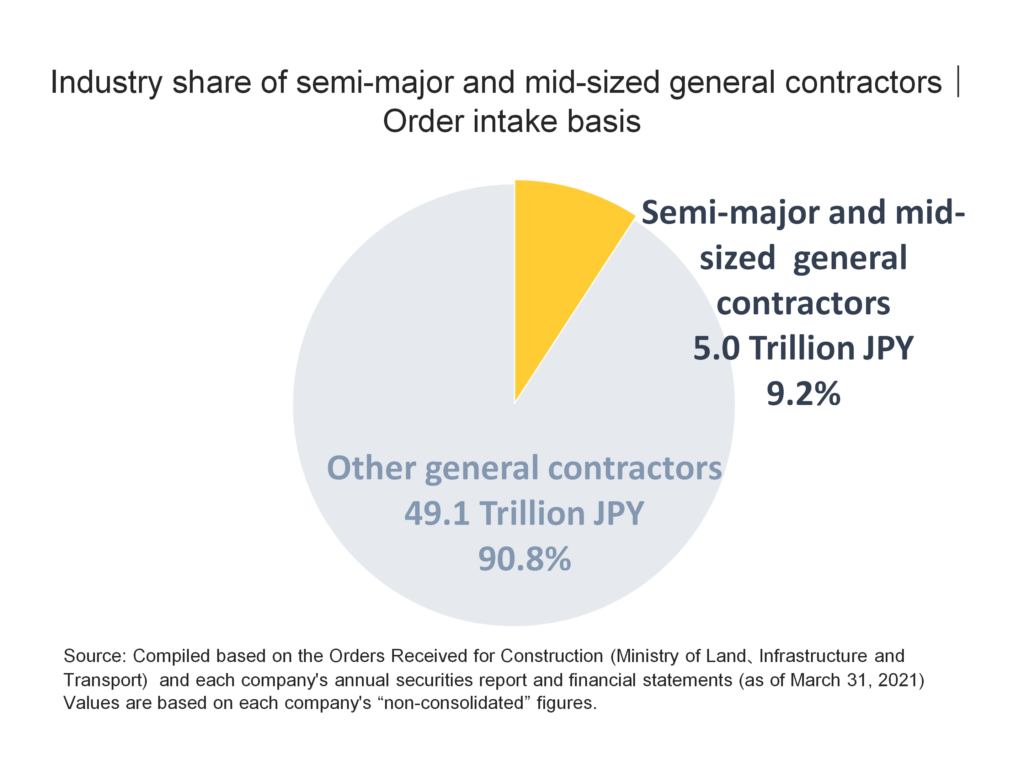
Considering that there are approximately 470,000 construction companies in Japan, the 18 semi-major and mid-sized general contractors account for less than 10% of the total construction industry, which means that they have a relatively strong influence on construction demand.
2. Sales
The average sales of semi-major and mid-sized general contractors in FY2020 was 276.5 billion yen, a decrease of approximately 10.4% from the previous year. Sales were on an upward trend from 216.5 billion yen in FY2011 to 271.4 billion yen in FY2015, and then declined slightly to 264 billion yen in FY2016. (See figure below)
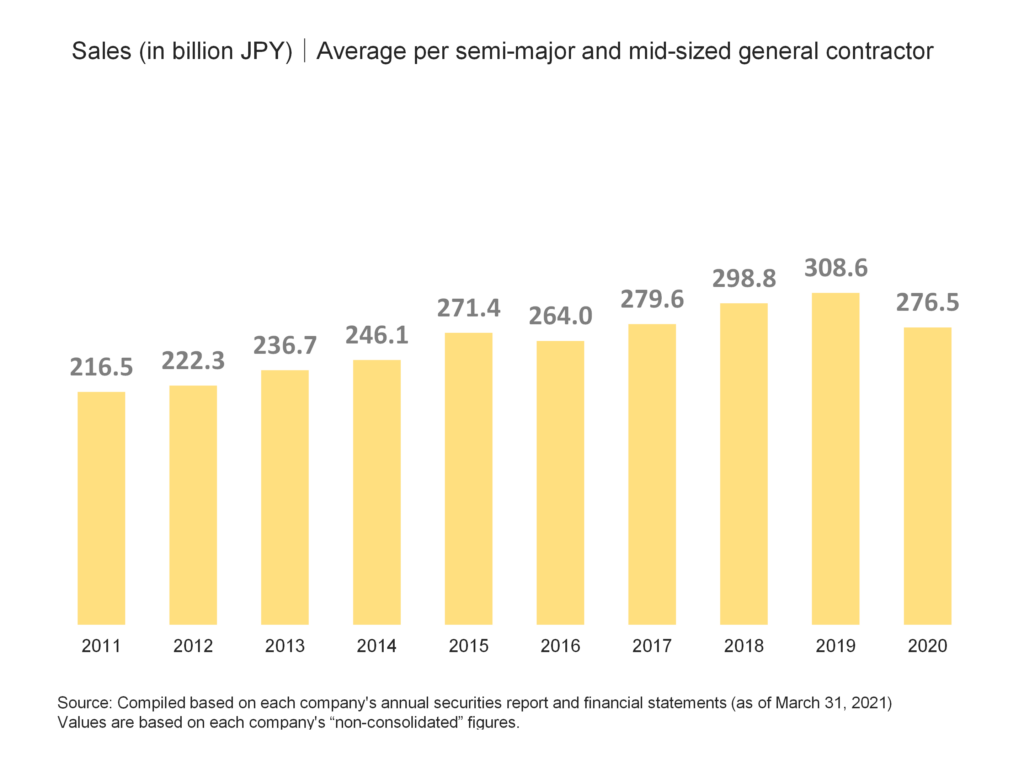
After that, it has been on an upward trend for three consecutive years, reaching 308.6 billion yen in FY2019, the highest level in the past 10 years. However, they are projected to decline in FY2020. Comparing FY2020 levels with FY2011 levels, when the market bottomed out, we can see that the level is about 27.7% higher.
3. Carryover balance
The average amount carried forward by semi-major and mid-sized general contractors in FY2020 was 43.3 billion yen, an increase of about 2.5% from the previous year. The amount carried over has been on a continuous upward trend for six consecutive years, from 230.3 billion yen in FY2012, when it bottomed out, to 435.9 billion yen in FY2018, the highest level in the last ten years. (See figure below)
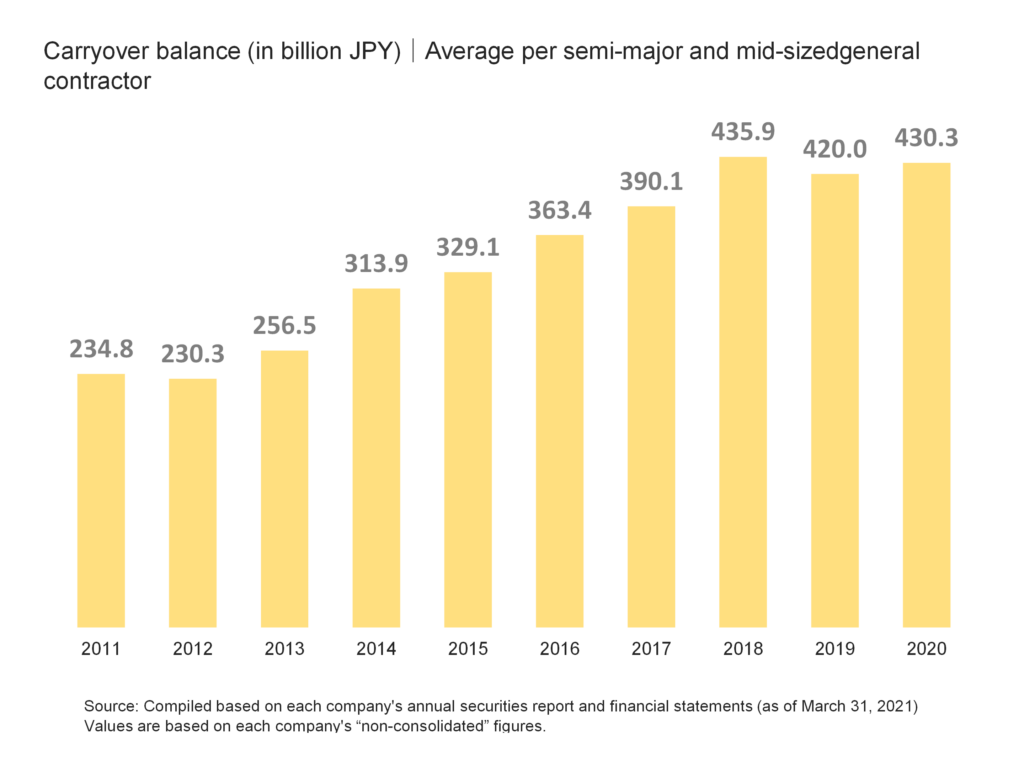
After that, the amount carried forward decreased to 420 billion yen in FY2019, but it started to increase in FY2020. The level in FY2020 is about 86.8% higher than the level in FY2012, which was the bottom of the market, indicating that the amount of construction work on hand that will be carried over to the next fiscal year is at a very high level.
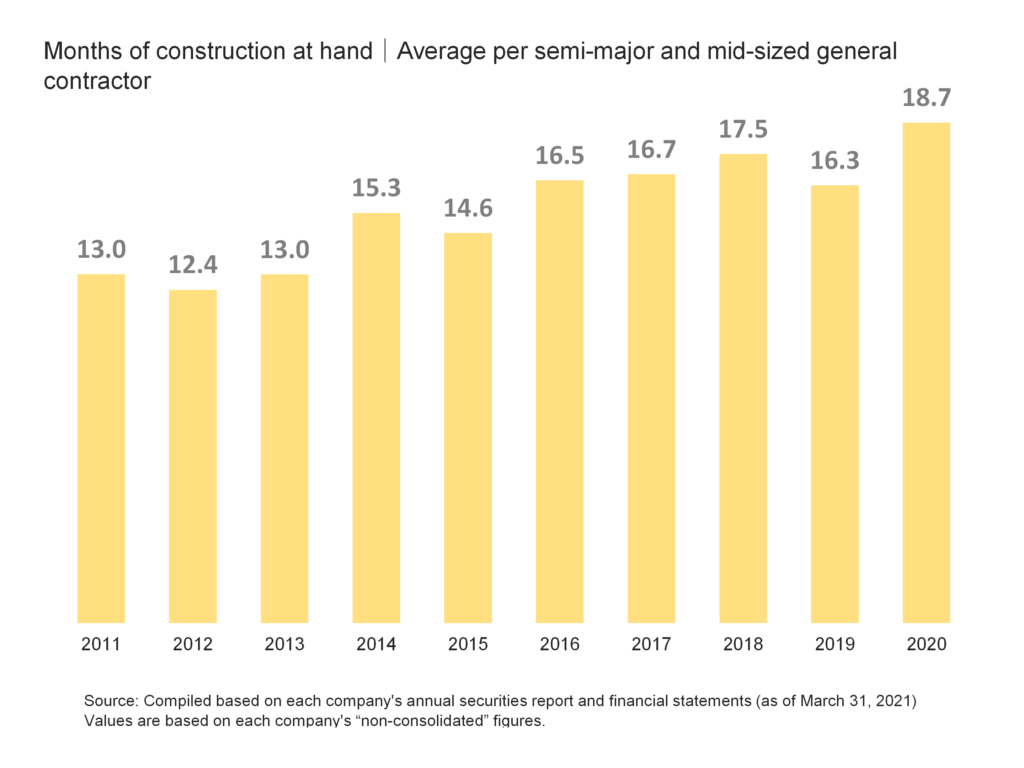
This indicates that the amount of work on hand that will be carried over to the next fiscal year is at a very high level. Here, we will also look at an indicator called the “months of construction at hand,” which indicates the period of time needed to finish the work on hand that construction companies carry-over at the end of the year.
In FY2020, the number of months of work on hand for semi-major and mid-sized general contractors was 18.7 months, down from 17.5 months in FY2018 to 16.3 months in FY2019, but still the highest level in the last 10 years. (See figure below)
4. Operating profit and operating profit margin
The operating profit of semi-major and mid-sized general contractors in FY2020 was 16 billion yen, a decrease of about 12.9% from the previous year. Operating profit has been on an upward trend for five consecutive years, from the bottom in FY2012 to 20.8 billion yen in FY2017 but has been on a downward trend for three consecutive years since FY2018. Levels in FY2020 are roughly the same as that of FY2015, and although they decreased from the previous year, they are still at a relatively high level. (See figure below)
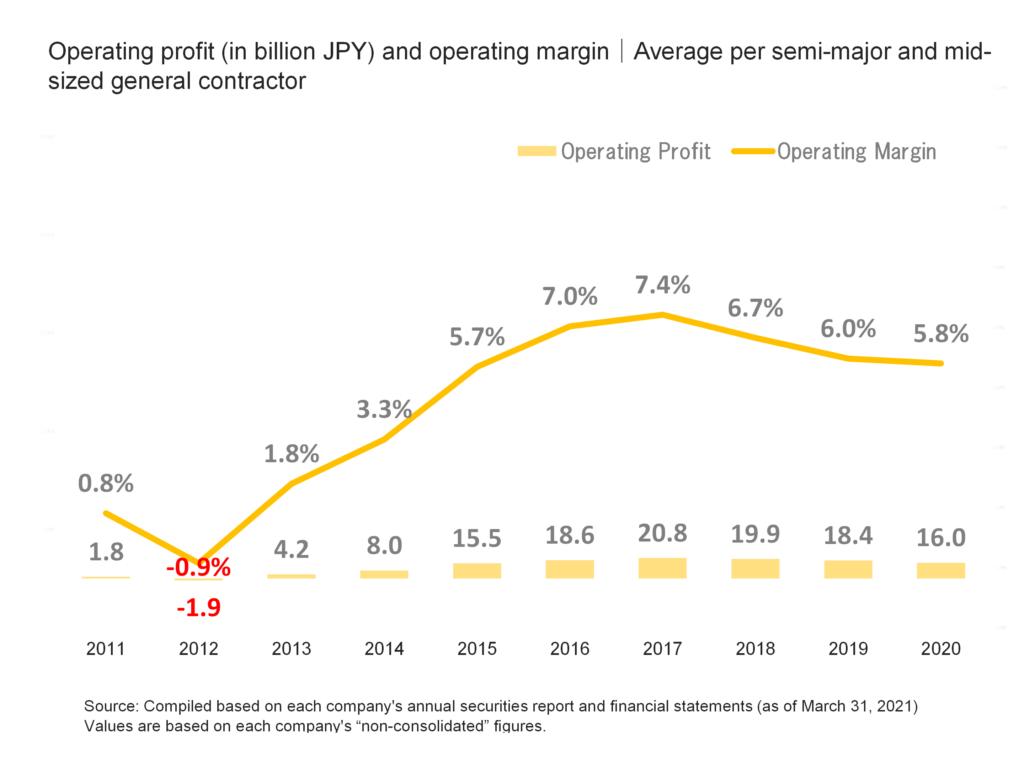
The operating margin for FY2020 is 5.8%, a decrease of 0.2% from the previous year. The operating margin has been on an upward trend for six consecutive years since bottoming out in FY2012, reflecting changes in operating income, and after rising to 7.4% in FY2017, the highest level in the past decade, it has declined for three consecutive years since FY2018.
5. Employee status
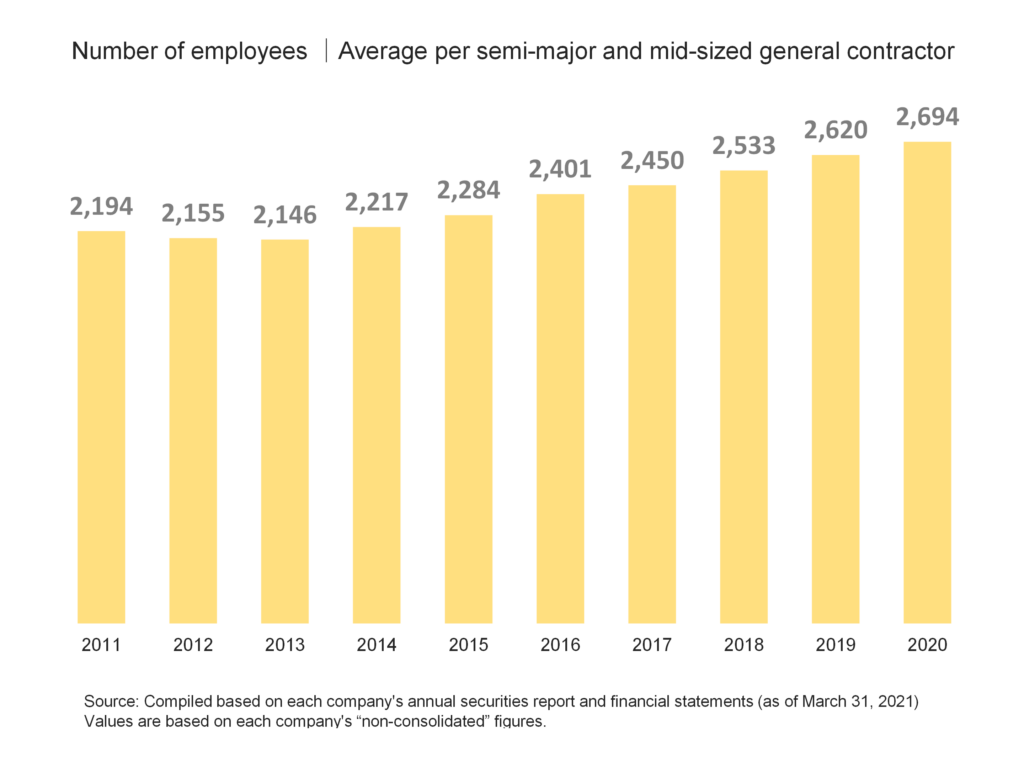
The number of employees of semi-major and mid-sized general contractors in FY2020 averaged 2,694, an increase of about 550 over the past seven years from 2,146 in FY2013, showing an upward trend for seven consecutive years. (See figure below)
In FY2020, the average age of employees at semi-major and mid-sized general contractors was 43.6 years, the average length of employment was 18.2 years, and the average annual salary was 8.674 million yen.
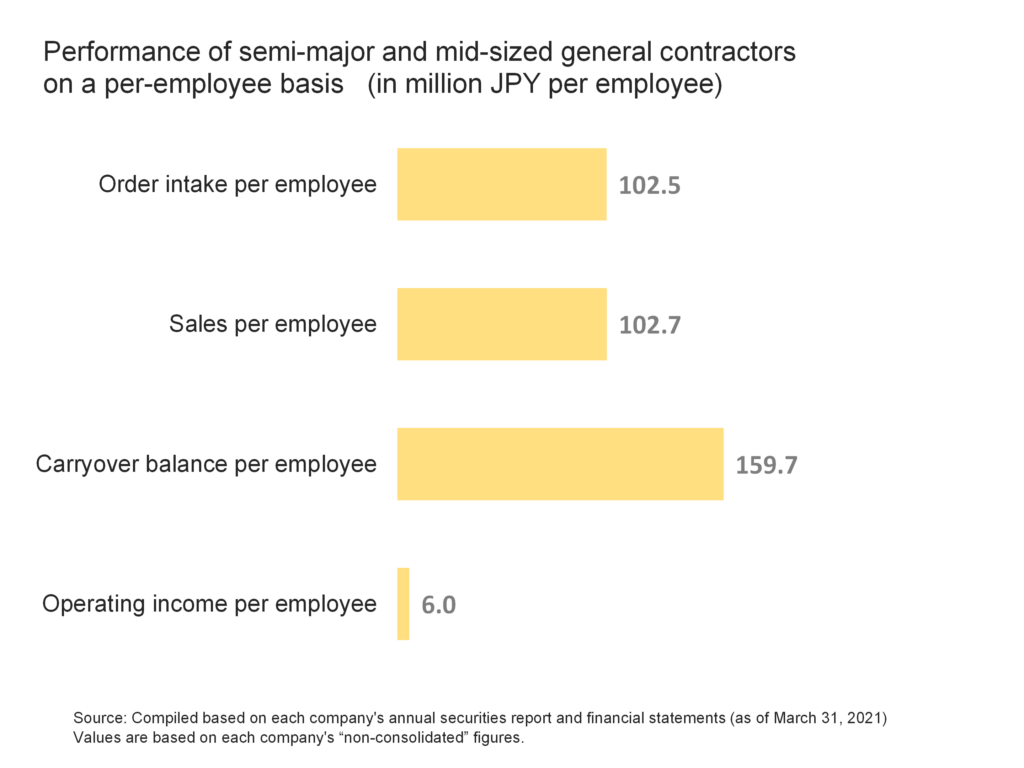
Looking at the performance of mid-sized general contractors on a per-employee basis, order intake, sales, carryover balance, and operating income per employee were approximately 102.5 (million yen/person), 102.7 (million yen/person), 159.7 (million yen/person), and 6.0 (million yen/person), respectively. (See the figure below)
Reference|Main data list
Finally, the following is a reference list of the 18 semi-major and mid-sized general contractors and the main data used in the survey.
list of the 18 semi-major and mid-sized general contractors
Data for Semi-Major and Mid-sized General Contractors in Japan by Business Performance
| item | value | notes |
|---|---|---|
| ① Order intake | 4,969 Billion JPY | Total of 18 semi-major and mid-sized general contractors |
| ② Sales | 4,977 Billion JPY | Total of 18 semi-major and mid-sized general contractors |
| ③ Carryover balance | 7,745 Billion JPY | Total of 18 semi-major and mid-sized general contractors |
| ④ Operating income | 289 Billion JPY | Total of 18 semi-major and mid-sized general contractors |
| ⑤ Operating profit margin | 5.8% | ④÷② |
| ⑥ Number of months of work on hand | 18.7 months | ③÷②×12months |
| ⑦ Number of employees | 48,484 | Total of 18 semi-major and mid-sized general contractors |
| ⑧ Average order intake | 276 Billion JPY | ①÷18 |
| ⑨ Average sales | 277 Billion JPY | ②÷18 |
| ⑩ Average carryover balance | 430 Billion JPY | ③÷18 |
| ⑪ Average operating income | 16 Billion JPY | ④÷18 |
| ⑫ Average number of employees | 2,694 | ⑦÷18 |
| ⑬ Average age of employees | 43.6 years | – |
| ⑭ Average length of employment | 18.2 years | – |
| ⑮ Average annual salary | 8.67 Million JPY | – |
| ⑯ Order intake per employee | 10.2 Million JPY per employee | ①÷⑦ |
| ⑰ Sales per employee | 10.3 Million JPY per employee | ②÷⑦ |
| ⑱ Carryover balance per employee | 16.0 Million JPY per employee | ③÷⑦ |
| ⑲ Operating income per employee | 0.6 Million JPY per employee | ④÷⑦ |
Source: Compiled based on each company’s annual securities report and financial statements (as of March 31, 2021) Values are based on each company’s “non-consolidated” figures.
Comment