Semi-Major General Contractors by Business Performance | 2021 edition
In this issue of the “State of General Contractors” series, which provides an overview of the status of Japan’s major general contractors based on their business performance, etc., we will introduce the status of semi-major general contractors.
Specifically, the following points will be introduced based on the status and trends of business performance, such as order intake, sales, and carryover balance in the fiscal year ending March 31, 2021.
- Order intake
- Sales
- Carryover balance
- Operating profit and operating profit margin
- Employee status
1. Order intake
In FY2020, orders received by the 10 semi-major general contractors averaged 369.6 billion yen, a decrease of approximately 4.4% from the previous year. Orders received had been on an upward trend from 276.3 billion yen in FY2012 to 404.1 billion yen in FY2014, and then declined to 377.2 billion yen in FY2015. (See figure below)
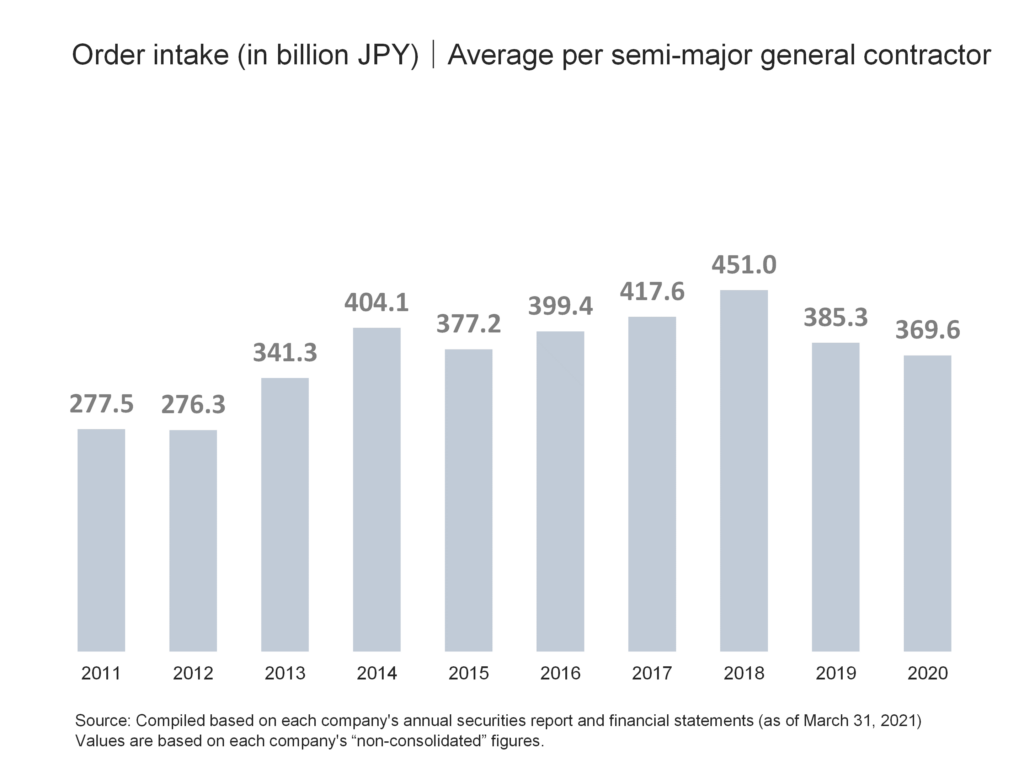
After that, it has been on an upward trend for three consecutive years since FY2016, reaching the highest level in the past 10 years at 451 billion yen in FY2018, but has been declining for two consecutive years since FY2019. FY2020 levels were about 33.8% higher than FY2012 levels, when figures bottomed out.
Looking at the industry share of semi-major general contractors in terms of order intake, the 10 semi-major general contractors account for 6.8% of the total construction industry. (See figure below)
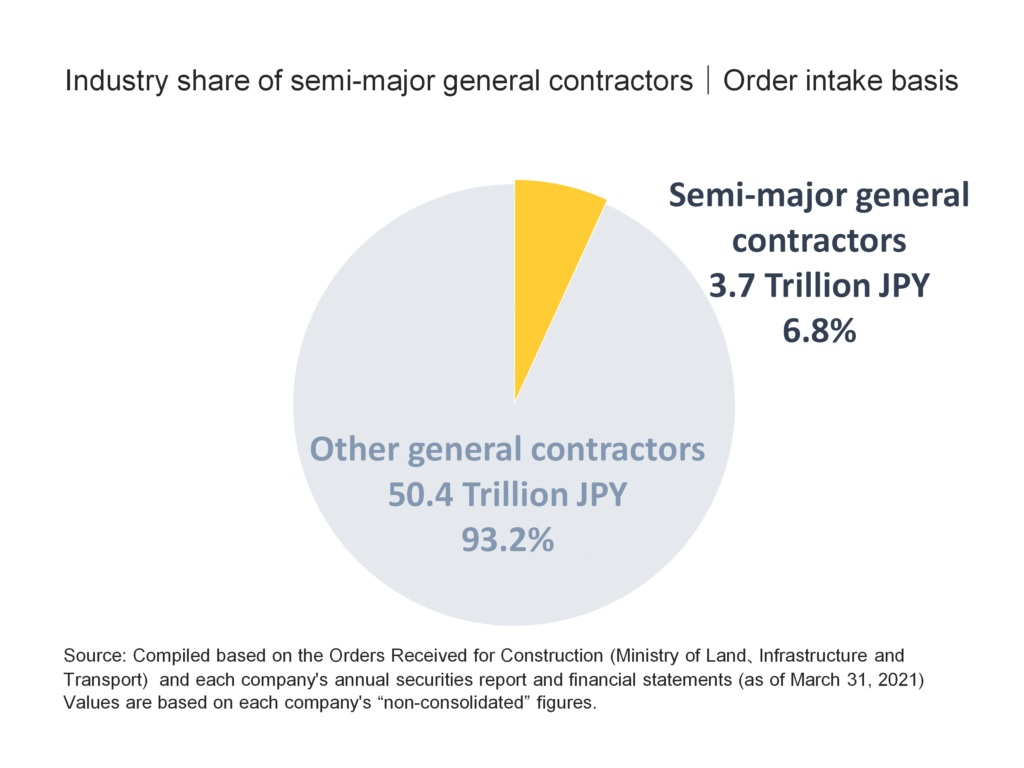
Considering that there are approximately 470,000 construction companies in Japan, the share of the 10 semi-major general contractors in the industry is relatively large, and they can be considered to have a certain influence on construction demand.
2. Sales
The average sales of semi-major general contractors in FY2020 was 377.5 billion yen, a decrease of about 11.9% from the previous year. After four consecutive years of growth, from 291.7 billion yen in FY2011 to 370 billion yen in FY2015, sales declined slightly to 363.6 billion yen in FY2016. (See figure below)
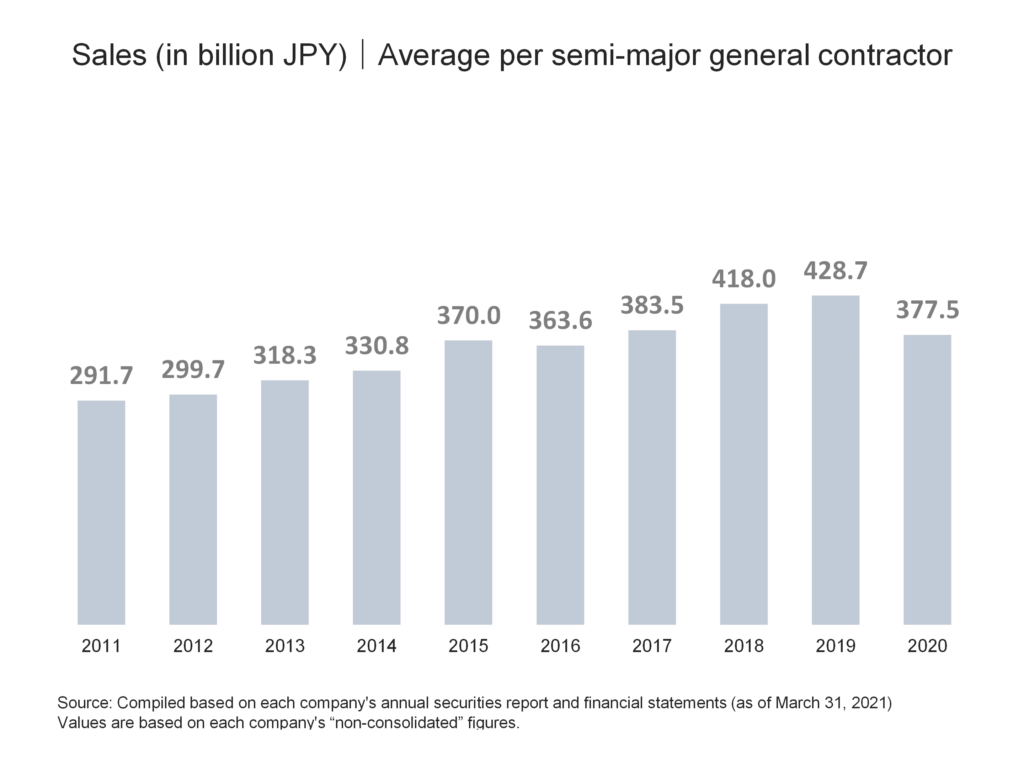
After that, figures have been on an upward trend for three consecutive years, reaching 428.7 billion yen in FY 2019, the highest level in the past 10 years, but has turned downward in FY2020. Comparing sales figures for FY2020 with those for FY 2011, when the market bottomed out, we can see that they are about 29.4% higher.
3. Carryover balance
The average amount carried forward by the major general contractors in FY2020 was 597.3 billion yen, an increase of about 1.8% from the previous year. The amount carried over had been on a continuous upward trend for six consecutive years, from 307.9 billion yen in FY2012, when it bottomed out, to 610.7 billion yen in FY2018. (See figure below)
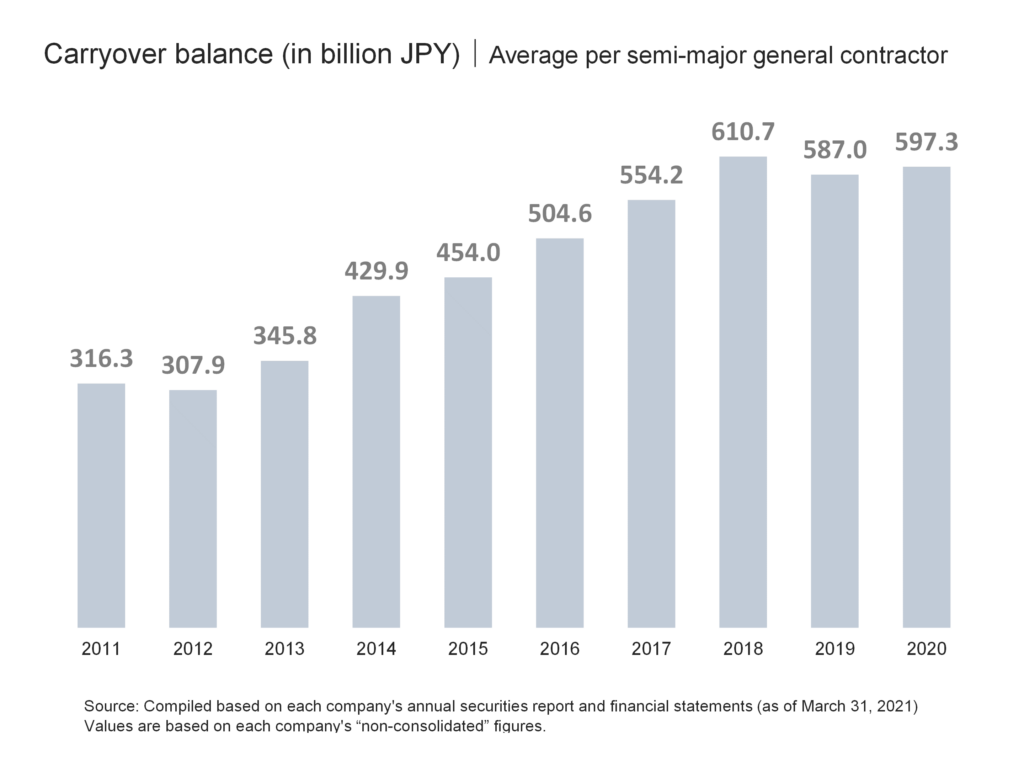
After that, numbers declined to 587 billion yen in FY2019, but began increasing again in FY2020. This shows that the amount of construction work on hand to be carried over to the next fiscal year is still at a very high level.
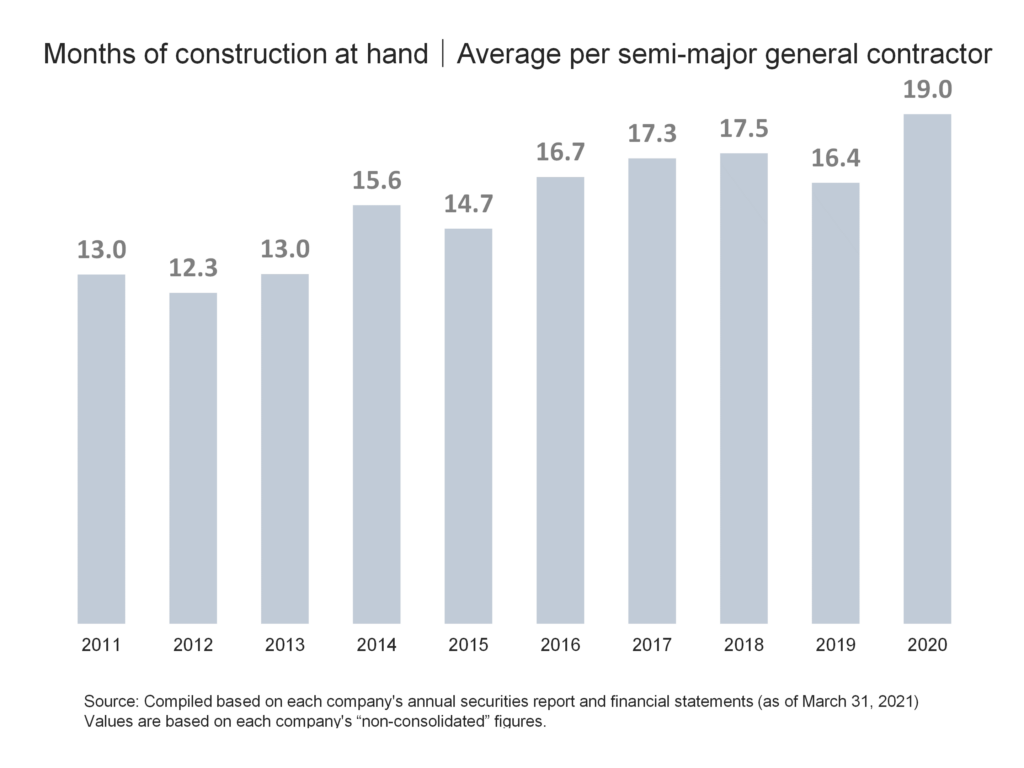
Here, we will also look at an indicator called the “months of construction at hand,” which indicates the period of time needed to finish the work on hand that construction companies carry-over at the end of the year.
In FY2020, the number of months of work on hand for semi-major general contractors was 19.0 months, an increase of 2.6 months from the previous year and the highest level in the last 10 years. (See figure below.)
4. Operating profit and operating profit margin
The operating profits of semi-major general contractors in FY2020 was 23 billion yen, a decrease of about 16.0% from the previous year. Operating profits have been on an upward trend for five consecutive years, from -3.1 billion yen in FY2012, when it bottomed out, to 31 billion yen in FY2017, but have declined for three consecutive years since FY2018. (See figure below)
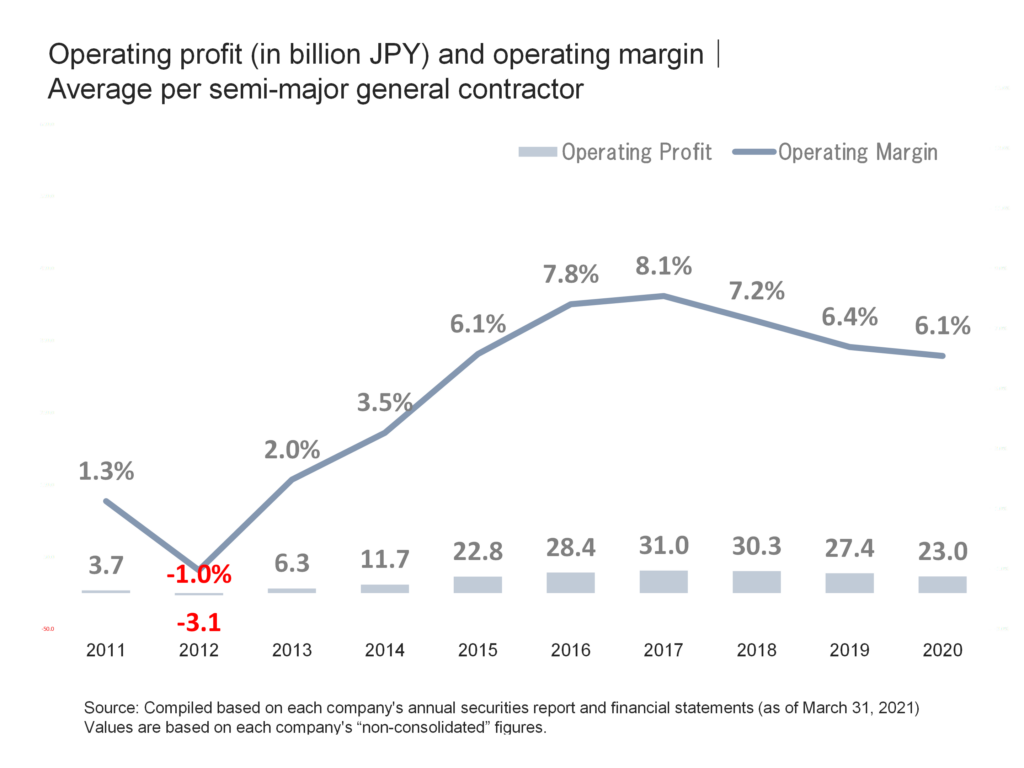
The operating margin for FY2020 was 6.1%, a slight decline from the previous year. The operating margin bottomed out in FY2012 and rose for five consecutive years to 8.1% in FY2017, before falling in FY2018 for the third consecutive year.
5. Employee status
The average number of employees of semi-major general contractors in FY2020 is 3,605, an increase of 7 consecutive years from 2,749 in FY2013. (See figure below)
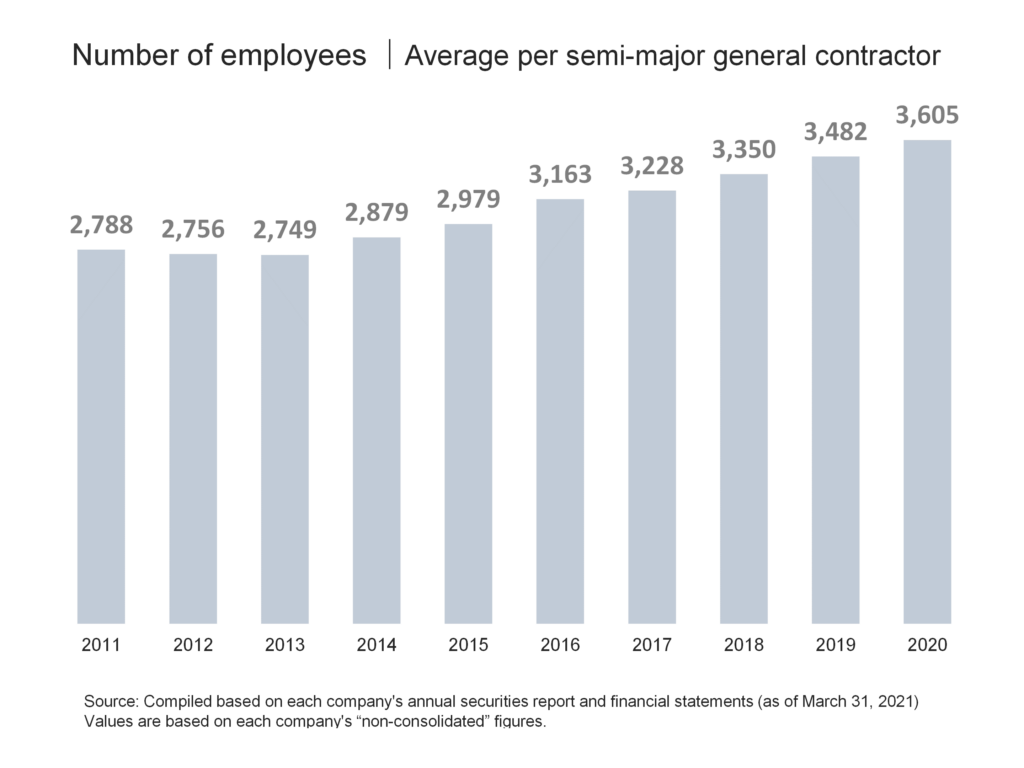
In FY2020, the average age of employees at semi-major general contractors was 43.7 years, the average length of employment was 18.3 years, and the average annual salary was 8.713 million yen.
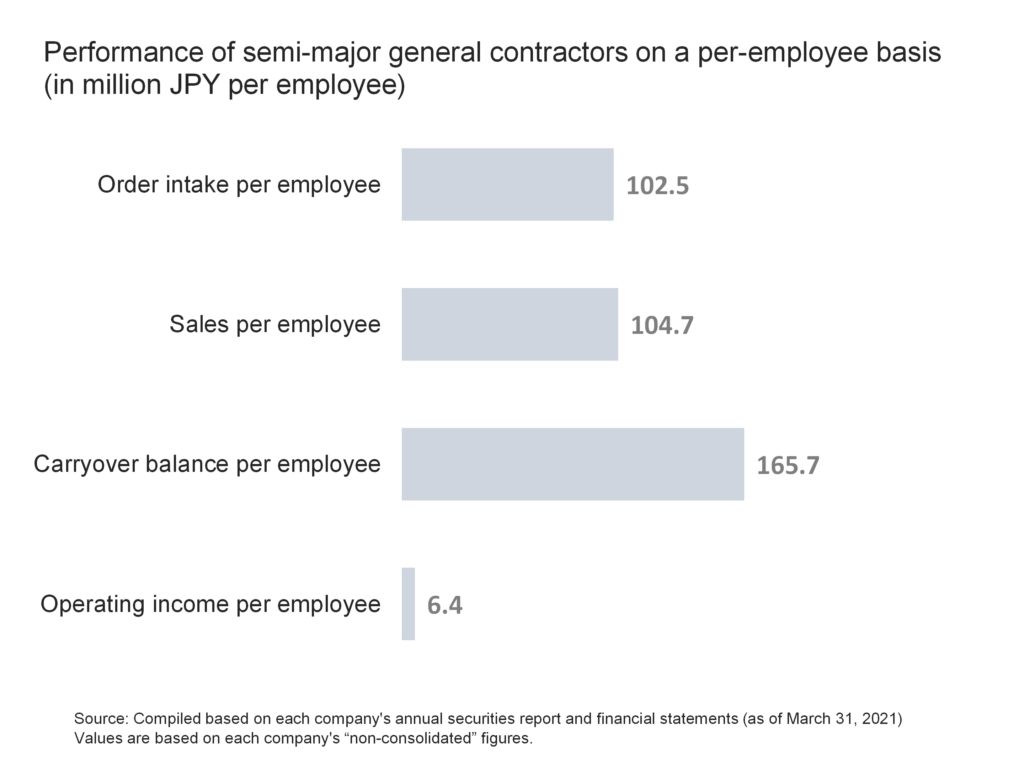
Furthermore, looking at the performance of super general contractors on a per-employee basis, order intake, sales, carry-over balance, and operating income per employee were approximately 102.5 (million yen/person), 104.7 (million yen/person), 165.7 (million yen/person), and 6.4 (million yen/person), respectively. (See the figure below)
Reference|Main data list
Finally, a list of key data from the 10 semi-major contractors and the data used in the survey is presented below for reference.
list of the 10 semi-major general contractors
Data for Semi-Major General Contractors in Japan by Business Performance
| item | value | notes |
|---|---|---|
| ① Order intake | 3,696 Billion JPY | Total of 10 semi-major general contractors |
| ② Sales | 3,775 Billion JPY | Total of 10 semi-major general contractors |
| ③ Carryover balance | 5,973 Billion JPY | Total of 10 semi-major general contractors |
| ④ Operating income | 230 Billion JPY | Total of 10 semi-major general contractors |
| ⑤ Operating profit margin | 6.1% | ④÷② |
| ⑥ Number of months of work on hand | 19.0 months | ③÷②×12months |
| ⑦ Number of employees | 36,053 | Total of 10 semi-major general contractors |
| ⑧ Average order intake | 370 Billion JPY | ①÷10 |
| ⑨ Average sales | 378 Billion JPY | ②÷10 |
| ⑩ Average carryover balance | 597 Billion JPY | ③÷10 |
| ⑪ Average operating income | 23 Billion JPY | ④÷10 |
| ⑫ Average number of employees | 3,605 | ⑦÷10 |
| ⑬ Average age of employees | 43.7 years | – |
| ⑭ Average length of employment | 18.3 years | – |
| ⑮ Average annual salary | 8.71 Million JPY | – |
| ⑯ Order intake per employee | 10.3 Million JPY per employee | ①÷⑦ |
| ⑰ Sales per employee | 10.5 Million JPY per employee | ②÷⑦ |
| ⑱ Carryover balance per employee | 16.6 Million JPY per employee | ③÷⑦ |
| ⑲ Operating income per employee | 0.6 Million JPY per employee | ④÷⑦ |
Source: Compiled based on each company’s annual securities report and financial statements (as of March 31, 2021) Values are based on each company’s “non-consolidated” figures.
Comment